Sears 2007 Annual Report Download - page 33
Download and view the complete annual report
Please find page 33 of the 2007 Sears annual report below. You can navigate through the pages in the report by either clicking on the pages listed below, or by using the keyword search tool below to find specific information within the annual report.-
 1
1 -
2
-
3
-
4
-
5
-
6
-
7
-
8
-
9
-
10
-
11
-
12
-
13
-
14
-
15
-
16
-
17
-
18
-
19
-
20
-
21
-
22
-
 23
23 -
 24
24 -
 25
25 -
 26
26 -
 27
27 -
 28
28 -
 29
29 -
 30
30 -
 31
31 -
 32
32 -
 33
33 -
 34
34 -
 35
35 -
 36
36 -
 37
37 -
 38
38 -
 39
39 -
 40
40 -
 41
41 -
 42
42 -
 43
43 -
44
-
45
-
46
-
47
-
48
-
49
-
50
-
51
-
52
-
53
-
54
-
55
-
56
-
57
-
58
-
59
-
60
-
61
-
62
-
63
-
64
-
65
-
66
-
67
-
68
-
69
-
70
-
71
-
72
-
73
-
74
-
75
-
76
-
77
-
78
-
79
-
80
-
81
-
82
-
83
-
84
-
85
-
86
-
87
-
88
-
89
-
90
-
91
-
92
-
93
-
94
-
95
-
96
-
97
-
98
-
99
-
100
-
101
-
102
-
103
-
104
-
105
-
106
-
107
-
108
-
109
-
110
 |
 |

of the settlement in the Visa/MasterCard antitrust litigation. This gain accounted for approximately 10 basis
points of the improvement in the selling and administrative expense rate. The remaining 40 basis point
improvement reflected lower costs across a number of expense categories, most notably store payroll and benefit
costs, which were reduced in fiscal 2006 as a result of store payroll efficiency initiatives.
Kmart recorded $71 million and $40 million in gains on sales of assets during fiscal 2006 and fiscal 2005,
respectively, with the increase for fiscal 2006 primarily attributable to a $41 million pre-tax gain recognized in
fiscal 2006 in connection with our 2005 sale of Kmart’s former corporate headquarters in Troy, Michigan.
Kmart recorded restructuring charges of $9 million and $54 million during fiscal 2006 and fiscal 2005,
respectively. The charges were for relocation assistance and employee termination-related costs incurred in
connection with Holdings’ home office integration efforts initiated in fiscal 2005.
Operating income for fiscal 2006 increased compared to fiscal 2005, primarily as a function of improved
expense management, as well as lower restructuring charges, as noted above. The favorable impact on operating
income derived from these factors, as well as the $19 million gain recorded on the settlement of the Visa/
MasterCard antitrust litigation and the increased gains on asset sales, was partially offset by a decline in total
gross margin dollars, as a result of lower overall sales levels, and, to a lesser degree, increased depreciation and
amortization expense.
Sears Domestic
As noted above, the consolidated statement of income for Holdings includes Sears Domestic’s results only
for the period subsequent to March 24, 2005 for fiscal 2005. We believe that an understanding of our reported
results and our ongoing financial performance is not complete without presenting Sears Domestic’s results of
operations on a pro forma basis for fiscal 2005. Accordingly, in addition to providing the reported results for
fiscal 2007, 2006 and 2005, the presentation below also provides the results of operations on a pro forma basis
for fiscal 2005.
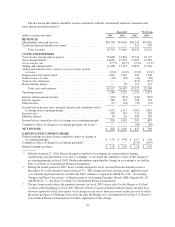
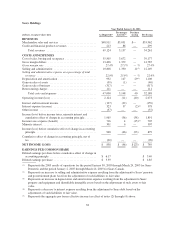
Sears Domestic results and key statistics were as follows:
Reported Pro Forma
millions, except for number of stores 2007 2006 2005 2005
Merchandise sales and services ............................... $27,845 $29,179 $25,868 $30,038
Cost of sales, buying and occupancy .......................... 19,589 20,120 18,221 21,239
Gross margin dollars ....................................... 8,256 9,059 7,647 8,799
Gross margin rate ......................................... 29.6% 31.0% 29.6% 29.3%
Selling and administrative ................................... 6,698 6,820 5,968 7,039
Selling and administrative expense as a percentage of total
revenues ............................................... 24.1% 23.4% 23.1% 23.4%
Depreciation and amortization ............................... 802 927 769 911
(Gain) loss on sales of assets ................................. (28) (11) 1 —
Total costs and expenses ................................ 27,061 27,856 24,959 29,189
Operating income ......................................... $ 784 $ 1,323 $ 909 $ 849
Number of:
Full-line Stores(1) ...................................... 935 935 924
Specialty Stores ....................................... 1,150 1,095 1,128
Total Domestic Sears Stores ................................. 2,085 2,030 2,052
(1) Fiscal 2007 includes 860 full-line stores and 75 Sears Essentials/Grand stores; Fiscal 2006 includes 861 full-
line stores and 74 Sears Essentials/Grand stores; Fiscal 2005 includes 866 full-line stores and 58 Sears
Essentials/Grand stores
33