Sears 2007 Annual Report Download - page 36
Download and view the complete annual report
Please find page 36 of the 2007 Sears annual report below. You can navigate through the pages in the report by either clicking on the pages listed below, or by using the keyword search tool below to find specific information within the annual report.-
 1
1 -
2
-
3
-
4
-
5
-
6
-
7
-
8
-
9
-
10
-
11
-
12
-
13
-
14
-
15
-
16
-
17
-
18
-
19
-
20
-
21
-
22
-
23
-
24
-
25
-
 26
26 -
 27
27 -
 28
28 -
 29
29 -
 30
30 -
 31
31 -
 32
32 -
 33
33 -
 34
34 -
 35
35 -
 36
36 -
 37
37 -
 38
38 -
 39
39 -
 40
40 -
 41
41 -
 42
42 -
 43
43 -
 44
44 -
 45
45 -
 46
46 -
47
-
48
-
49
-
50
-
51
-
52
-
53
-
54
-
55
-
56
-
57
-
58
-
59
-
60
-
61
-
62
-
63
-
64
-
65
-
66
-
67
-
68
-
69
-
70
-
71
-
72
-
73
-
74
-
75
-
76
-
77
-
78
-
79
-
80
-
81
-
82
-
83
-
84
-
85
-
86
-
87
-
88
-
89
-
90
-
91
-
92
-
93
-
94
-
95
-
96
-
97
-
98
-
99
-
100
-
101
-
102
-
103
-
104
-
105
-
106
-
107
-
108
-
109
-
110
 |
 |

Sears Canada
Sears Canada, a consolidated, 70%-owned subsidiary of Sears, conducts retail and credit operations. In
November 2005, Sears Canada completed the sale of its Credit and Financial Services operations.
As noted above, the consolidated statement of income for Holdings includes Sears Canada’s results only for
the period subsequent to March 24, 2005 for fiscal 2005. We believe that an understanding of our reported results
and our ongoing financial performance is not complete without presenting Sears Canada’s results of operations
on a pro forma basis for fiscal 2005. Accordingly, in addition to providing the reported results for fiscal 2007,
2006 and fiscal 2005, the presentation below also provides the results of operations on a pro forma basis for
fiscal 2005.
During the fourth quarter of 2007, Sears Canada changed its fiscal year end from the Saturday nearest
December 31st to the Saturday nearest January 31st. This change has been retrospectively applied to prior year
amounts reported in fiscal 2006 and 2005 as required by Statement of Financial Accounting Standards No. 154,
“Accounting Changes and Error Corrections—A Replacement of Accounting Principles Board (APB) Opinion
No. 20 and SFAS No. 3.” See Note 3 of Notes to Consolidated Financial Statements for further explanation of
this change.
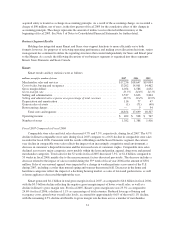
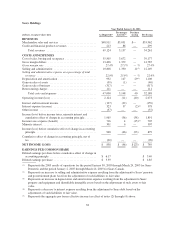
Sears Canada results and key statistics were as follows:
millions, except for number of stores Reported Pro Forma
2007 2006 2005 2005
Merchandise sales and services .................................. $5,602 $5,190 $4,280 $4,830
Credit and financial products revenues ............................ — — 213 299
Total revenues ........................................... 5,602 5,190 4,493 5,129
Cost of sales, buying and occupancy ............................. 3,847 3,643 3,060 3,476
Gross margin dollars .......................................... 1,755 1,547 1,220 1,354
Gross margin rate ............................................ 31.3% 29.8% 28.5% 28.0%
Selling and administrative ...................................... 1,233 1,131 1,120 1,306
Selling and administrative expense as a percentage of total revenues .... 22.0% 21.8% 24.9% 25.5%
Depreciation and amortization .................................. 131 139 126 150
Gain on sales of assets ......................................... (9) — — —
Gain on sale of business ....................................... — — (317) (317)
Restructuring charges ......................................... — 19 57 57
Total costs and expenses ................................... 5,202 4,932 4,046 4,672
Operating income ............................................ $ 400 $ 258 $ 447 $ 457
Number of:
Full-line Stores .......................................... 121 123 123
Specialty Stores .......................................... 259 250 252
Total Sears Canada Stores ...................................... 380 373 375
Fiscal 2007 Compared to Fiscal 2006
Total revenues increased 7.9% to $5.6 billion in fiscal 2007, as compared to revenues of $5.2 billion in
fiscal 2006. The increase in revenues was mainly due to the impact of favorable exchange rates, as the Canadian
dollar strengthened during fiscal 2007 relative to fiscal 2006.
The gross margin rate for fiscal 2007 as compared to fiscal 2006 increased 1.5% to 31.3% in 2007. The
increase was primarily due to improved inventory management during the year, as well as the favorable impact
of a stronger Canadian dollar on the cost of imported merchandise.
36