Sears 2007 Annual Report Download - page 39
Download and view the complete annual report
Please find page 39 of the 2007 Sears annual report below. You can navigate through the pages in the report by either clicking on the pages listed below, or by using the keyword search tool below to find specific information within the annual report.-
 1
1 -
2
-
3
-
4
-
5
-
6
-
7
-
8
-
9
-
10
-
11
-
12
-
13
-
14
-
15
-
16
-
17
-
18
-
19
-
20
-
21
-
22
-
23
-
24
-
25
-
26
-
27
-
28
-
 29
29 -
 30
30 -
 31
31 -
 32
32 -
 33
33 -
 34
34 -
 35
35 -
 36
36 -
 37
37 -
 38
38 -
 39
39 -
 40
40 -
 41
41 -
 42
42 -
 43
43 -
 44
44 -
 45
45 -
 46
46 -
 47
47 -
 48
48 -
 49
49 -
50
-
51
-
52
-
53
-
54
-
55
-
56
-
57
-
58
-
59
-
60
-
61
-
62
-
63
-
64
-
65
-
66
-
67
-
68
-
69
-
70
-
71
-
72
-
73
-
74
-
75
-
76
-
77
-
78
-
79
-
80
-
81
-
82
-
83
-
84
-
85
-
86
-
87
-
88
-
89
-
90
-
91
-
92
-
93
-
94
-
95
-
96
-
97
-
98
-
99
-
100
-
101
-
102
-
103
-
104
-
105
-
106
-
107
-
108
-
109
-
110
 |
 |

(6) Represents the 2005 results of operations for the period January 2, 2005 through January 28, 2006 for
Kmart, the period March 25, 2005 through January 28, 2006 for Sears Domestic and the period from
March 25, 2005 through December 31, 2005 for Sears Canada. Results of Sears Canada for the period
March 25, 2005 through December 31, 2005 have not been updated to reflect the impact of its change in
year end, which occurred during the fourth quarter of fiscal 2007.
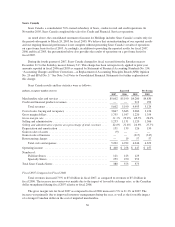
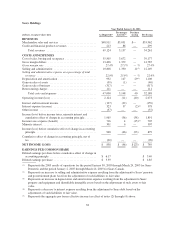
Sears Domestic
Year Ended January 28, 2006
millions As Reported
Pre-merger
Activity(1)
Purchase
Acctng Pro Forma
Merchandise sales and services ........................... $25,868 $4,170 $— $30,038
Cost of sales, buying and occupancy ....................... 18,221 3,018 — 21,239
Gross margin dollars .................................... 7,647 1,152 — 8,799
Gross margin rate ...................................... 29.6% 27.6% — % 29.3%
Selling and administrative ............................... 5,968 1,060 11(2) 7,039
Selling and administrative expense as a percentage of total
revenues ........................................... 23.1% 25.4% — % 23.4%
Depreciation and amortization ............................ 769 116 26
(3) 911
Loss (gain) on sales of assets ............................. 1 (1) — —
Total costs and expenses ............................. 24,959 4,193 37 29,189
Operating income (loss) ................................. $ 909 $ (23) $ (37) $ 849
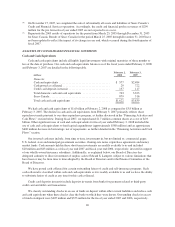
Sears Canada
Year Ended January 28, 2006
millions As Reported(5)
Pre-merger
Activity(1)
Purchase
Acctng Pro Forma
Merchandise sales and services .......................... $3,949 $ 881 $— $4,830
Credit and financial products revenues(4) ................... 213 86 — 299
Total revenues ................................... 4,162 967 — 5,129
Cost of sales, buying and occupancy ...................... 2,822 654 — 3,476
Gross margin dollars .................................. 1,127 227 — 1,354
Gross margin rate .................................... 28.5% 25.8% — % 28.0%
Selling and administrative .............................. 1,036 270 — 1,306
Selling and administrative expense as a percentage of total
revenues .......................................... 24.9% 27.9% — % 25.5%
Depreciation and amortization ........................... 116 31 3
(3) 150
Gain on sale of business ................................ (317) — — (317)
Restructuring charges .................................. 57 — — 57
Total costs and expenses ........................... 3,714 955 3 4,672
Operating income (loss) ................................ $ 448 $ 12 $ (3) $ 457
(1) Represents the 2005 results of operations for the period January 30, 2005 through March 24, 2005 for Sears
Domestic and the period January 2, 2005 through March 24, 2005 for Sears Canada.
(2) Represents an increase to selling and administrative expense resulting from the adjustment to Sears’ pension
and postretirement plans based on the adjustment of such liabilities to fair value.
(3) Represents an increase in depreciation and amortization expense resulting from the adjustment to Sears’
property and equipment and identifiable intangible assets based on the adjustment of such assets to fair
value.
39