Sears 2007 Annual Report Download - page 32
Download and view the complete annual report
Please find page 32 of the 2007 Sears annual report below. You can navigate through the pages in the report by either clicking on the pages listed below, or by using the keyword search tool below to find specific information within the annual report.-
 1
1 -
2
-
3
-
4
-
5
-
6
-
7
-
8
-
9
-
10
-
11
-
12
-
13
-
14
-
15
-
16
-
17
-
18
-
19
-
20
-
21
-
 22
22 -
 23
23 -
 24
24 -
 25
25 -
 26
26 -
 27
27 -
 28
28 -
 29
29 -
 30
30 -
 31
31 -
 32
32 -
 33
33 -
 34
34 -
 35
35 -
 36
36 -
 37
37 -
 38
38 -
 39
39 -
 40
40 -
 41
41 -
 42
42 -
43
-
44
-
45
-
46
-
47
-
48
-
49
-
50
-
51
-
52
-
53
-
54
-
55
-
56
-
57
-
58
-
59
-
60
-
61
-
62
-
63
-
64
-
65
-
66
-
67
-
68
-
69
-
70
-
71
-
72
-
73
-
74
-
75
-
76
-
77
-
78
-
79
-
80
-
81
-
82
-
83
-
84
-
85
-
86
-
87
-
88
-
89
-
90
-
91
-
92
-
93
-
94
-
95
-
96
-
97
-
98
-
99
-
100
-
101
-
102
-
103
-
104
-
105
-
106
-
107
-
108
-
109
-
110
 |
 |
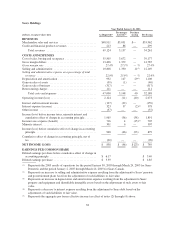
categories, most notably in the apparel and home categories. Increased markdowns had a negative impact on our
margins in these categories as we made efforts to clear seasonal apparel, as well as lawn and garden and other
home products affected by the slowdown in the housing market.
For fiscal 2007, Kmart’s selling and administrative expense rate was 20.5%, as compared to 19.4% for fiscal
2006. Fiscal 2006 selling and administrative expenses included a $19 million gain, representing Kmart’s portion
of the settlement in the Visa/MasterCard antitrust litigation. Excluding this gain, Kmart’s selling and
administrative expense rate was 19.5% for fiscal 2006. While total selling and administrative expenses declined
$86 million in fiscal 2007, mainly as the result of reduced payroll and benefits expense including lower
performance-based compensation, the current year selling and administrative rate increased, reflecting lower
expense leverage against sales for this fiscal year.
Kmart recorded $1 million and $71 million in gains on sales of assets during fiscal 2007 and fiscal 2006,
respectively. Gains recorded on sales of assets in fiscal 2006 included a $41 million pre-tax gain recognized in
connection with our 2005 sale of Kmart’s former corporate headquarters in Troy, Michigan.
Kmart recorded restructuring charges of $9 million during fiscal 2006. The charges were for relocation
assistance and employee termination-related costs incurred in connection with Holdings’ home office integration
efforts initiated in fiscal 2005. No such charges were recorded in fiscal 2007.
Operating income was $402 million in fiscal year 2007, as compared to operating income of $948 million in
fiscal 2006, a decline of $546 million. As discussed above, declines primarily reflect the negative gross margin
impact of lower sales levels, as well as a decline in Kmart’s gross margin rate in 2007. In addition to the above-
noted decline in gross margin, the decline reflects, to a lesser degree, the impact of higher depreciation and
amortization expense, and lower gains on sales of assets in fiscal 2007, partially offset by the favorable impact of
lower selling and administrative expenses and a decrease in restructuring costs.
Fiscal 2006 Compared to Fiscal 2005
Comparable store sales and total sales decreased 0.6% and 2.3%, respectively, during fiscal 2006. The 0.6%
decline in Kmart comparable store sales during fiscal 2006 compares to a 1.2% decline in comparable store sales
recorded for fiscal 2005. The fiscal 2006 decline in comparable store sales reflected the continued impact of increased
competition and lower transaction volumes recorded across most businesses. Comparable store apparel sales increased
for a second straight year during fiscal 2006, but as was the case in fiscal 2005, this improvement was more than offset
by comparable store sales declines across most other Kmart merchandise categories. Total sales in fiscal 2006
benefited from $301 million in sales recorded during the 53rd week of the 53-week fiscal year, partially offset by the
fact that $153 million of sales were recorded during the first quarter of fiscal 2005 as a result of three additional days
being included in fiscal 2005 due to our change from a Wednesday to a Saturday month end that year. However, the
net favorable impact on fiscal 2006 sales derived from these items (approximately 0.8%) was more than offset by the
negative impact of a reduction in the total number of Kmart stores in operation during fiscal 2006, as compared to
fiscal 2005. Store closures and conversions accounted for an approximate 2.4% decline in total Kmart sales for fiscal
2006, as fiscal 2005 total sales benefited from sales generated at stores subsequently closed in fiscal 2006, as well as
partial-year sales recorded in stores closed during fiscal 2005. A net total of 28 Kmart stores were closed during fiscal
2006, including 16 Kmart stores converted to a Sears Essentials/Grand format. The remaining balance of the decline in
total sales for fiscal 2006, as compared to fiscal 2005, was due to the above-noted decline in comparable store sales.
The gross margin rate was 24.6% in fiscal 2006, as compared to 24.3% for fiscal 2005. The improvement
reflected better margin management across a number of businesses, most notably within apparel, where an
increased use of direct-sourced merchandise obtained at a lower cost to us, as well as enhanced profitability of
promotional activity improved gross margin.
The selling and administrative expense rate was 19.4% for fiscal 2006, as compared to 19.9% for fiscal
2005. Fiscal 2006 selling and administrative expenses included a $19 million gain, representing Kmart’s portion
32