Sears 2007 Annual Report Download - page 84
Download and view the complete annual report
Please find page 84 of the 2007 Sears annual report below. You can navigate through the pages in the report by either clicking on the pages listed below, or by using the keyword search tool below to find specific information within the annual report.
SEARS HOLDINGS CORPORATION
Notes to Consolidated Financial Statements—(Continued)
The computation of dilutive shares outstanding excludes out-of-the-money stock options because such
outstanding options’ exercise prices are greater than the average market price of our common shares and,
therefore, the effect would be antidilutive.
NOTE 12—SHAREHOLDERS’ EQUITY
Stock-based Compensation
We account for stock-based compensation using the fair value method in accordance with SFAS
No. 123(R). We recorded $29 million, $21 million, and $26 million in total compensation expense relative to
stock-based compensation arrangements during fiscal 2007, fiscal 2006, and fiscal 2005, respectively. As of
February 2, 2008, we had $52 million in total compensation cost related to nonvested awards, which is expected
to be recognized over the next approximately 3 years.
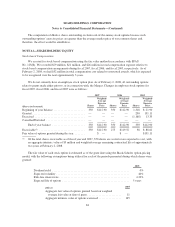
We do not currently have an employee stock option plan. As of February 2, 2008, all outstanding options
relate to grants made either prior to, or in connection with, the Merger. Changes in employee stock options for
fiscal 2007, fiscal 2006, and fiscal 2005 were as follows:
(Shares in thousands)
2007 2006 2005
Shares
Weighted-
Average
Exercise
Price Shares
Weighted-
Average
Exercise
Price Shares
Weighted-
Average
Exercise
Price
Beginning of year balance ...................... 350 $112.90 350 $112.90 1,318 $ 21.90
Granted ..................................... — — — — 200 131.11
Exercised ................................... — — — — (1,168) 13.33
Cancelled/Forfeited ........................... — — — — — —
End of year balance ....................... 350 $112.90 350 $112.90 350 $112.90
Exercisable(1) ................................ 350 $112.90 275 $119.52 38 $ 88.62
Fair value of options granted during the year ....... $ — $ — $131.11
(1) Of the total shares exercisable as of fiscal year end 2007, 350 shares are vested or are expected to vest, with
an aggregate intrinsic value of $3 million and weighted-average remaining contractual life of approximately
two years at February 2, 2008.
The fair value of each stock option is estimated as of the grant date using the Black-Scholes option-pricing
model, with the following assumptions being utilized for each of the periods presented during which shares were
granted:
2005
Dividend yield ...................................................... 0%
Expected volatility ................................................... 40%
Risk-free interest rate ................................................. 4.22%
Expected life of options ............................................... 5years
millions 2005
Aggregate fair value of options granted based on weighted
average fair value at date of grant ........................ 11
Aggregate intrinsic value of options exercised ................ 145
84


