Sears 2007 Annual Report Download - page 37
Download and view the complete annual report
Please find page 37 of the 2007 Sears annual report below. You can navigate through the pages in the report by either clicking on the pages listed below, or by using the keyword search tool below to find specific information within the annual report.-
 1
1 -
2
-
3
-
4
-
5
-
6
-
7
-
8
-
9
-
10
-
11
-
12
-
13
-
14
-
15
-
16
-
17
-
18
-
19
-
20
-
21
-
22
-
23
-
24
-
25
-
26
-
 27
27 -
 28
28 -
 29
29 -
 30
30 -
 31
31 -
 32
32 -
 33
33 -
 34
34 -
 35
35 -
 36
36 -
 37
37 -
 38
38 -
 39
39 -
 40
40 -
 41
41 -
 42
42 -
 43
43 -
 44
44 -
 45
45 -
 46
46 -
 47
47 -
48
-
49
-
50
-
51
-
52
-
53
-
54
-
55
-
56
-
57
-
58
-
59
-
60
-
61
-
62
-
63
-
64
-
65
-
66
-
67
-
68
-
69
-
70
-
71
-
72
-
73
-
74
-
75
-
76
-
77
-
78
-
79
-
80
-
81
-
82
-
83
-
84
-
85
-
86
-
87
-
88
-
89
-
90
-
91
-
92
-
93
-
94
-
95
-
96
-
97
-
98
-
99
-
100
-
101
-
102
-
103
-
104
-
105
-
106
-
107
-
108
-
109
-
110
 |
 |
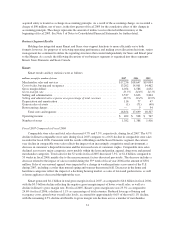
The selling and administrative expense rate increased slightly for fiscal 2007 as compared to fiscal 2006.
The increase was primarily due to small increases in advertising expense in connection with a program to
discourage cross-border shopping, which increased during the year due to a strengthening Canadian dollar.
Operating income was $400 million in fiscal 2007 as compared to $258 million in fiscal 2006. As discussed,
the increase was the result of increased sales (mainly due to the impact of favorable exchange rates) in addition
to increases in gross margin during the year, while controlling costs to ensure profitable growth. The increase in
2007 is also partially due to the absence of restructuring charges during the year, as compared to $19 million of
such expenses incurred during 2006.
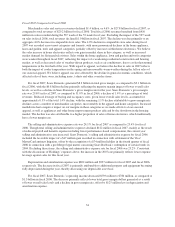
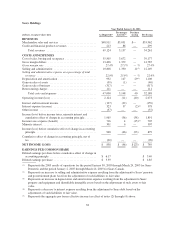
Fiscal 2006 Compared to Fiscal 2005
The discussion below pertains to pro forma information in the table above, which compares Sears Canada’s
results for fiscal 2006 with Sears Canada’s results for fiscal 2005. These pro forma results have been prepared
assuming the Merger occurred at the beginning of fiscal 2005.
Total revenues increased 1.2% to $5.2 billion in fiscal 2006, as compared to revenues of $5.1 billion in
fiscal 2005. The increase was due primarily to the impact of favorable exchange rates, as the Canadian dollar
strengthened during fiscal 2006 relative to fiscal 2005. Excluding the impact of exchange rates, total revenues
declined 5% versus fiscal 2005, primarily reflecting the impact of the sale of Sears Canada’s Credit and Financial
Services operations in November 2005. The revenue stream from Sears Canada’s Credit and Financial Services
operations was replaced in part by performance payments received pursuant to the strategic alliance with
JPMorgan Chase. The performance payments are classified within merchandise sales and services and, along
with the impact of favorable exchange rates, largely account for the increase in merchandise sales and services
revenues as compared to fiscal 2005. Sears Canada comparable store sales declined 1.1% during fiscal 2006, as
increased sales in major appliances and footwear were more than offset by declines across most other
merchandise categories.
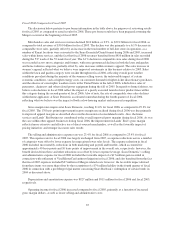
The gross margin rate for fiscal 2006 as compared to fiscal 2005 increased primarily due to the combined
effect of improved inventory management and less inventory shrinkage, as well as the favorable impact of a
stronger Canadian dollar on the cost of imported merchandise.
The selling and administrative expense rate declined for fiscal 2006 as compared to fiscal 2005 primarily
due to the sale of Sears Canada’s Credit and Financial Services operations, the positive impact of productivity
initiatives initiated at Sears Canada in late fiscal 2005, and a reduction in marketing costs.
Restructuring charges of $19 million and $57 million were recognized during fiscal 2006 and fiscal 2005,
respectively, in connection with the above-noted productivity initiatives.
Operating income was $258 million in fiscal 2006 as compared to $457 million in fiscal 2005. Fiscal 2005
operating income included a gain on sale of business totaling $317 million recorded to reflect the above-noted
minority interest gain on the sale of Sears Canada’s Credit and Financial Services business in November 2005.
Excluding this gain, operating income increased $118 million in fiscal 2006, as the impact of a decline in
revenues resulting from the sale of Sears Canada’s Credit and Financial Services operations was more than offset
by increased gross margin dollars and lower expenses, including $38 million less in restructuring expenses.
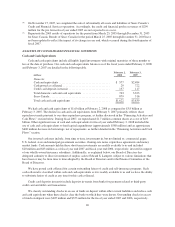
Pro Forma Reconciliation
The following tables provide a reconciliation from the as reported results to the pro forma results presented
above for Sears Holdings for the year ended January 28, 2006, as well as for Sears Domestic and Sears Canada
for the year ended January 28, 2006.
37