Sears 2007 Annual Report Download - page 26
Download and view the complete annual report
Please find page 26 of the 2007 Sears annual report below. You can navigate through the pages in the report by either clicking on the pages listed below, or by using the keyword search tool below to find specific information within the annual report.-
 1
1 -
2
-
3
-
4
-
5
-
6
-
7
-
8
-
9
-
10
-
11
-
12
-
13
-
14
-
15
-
 16
16 -
 17
17 -
 18
18 -
 19
19 -
 20
20 -
 21
21 -
 22
22 -
 23
23 -
 24
24 -
 25
25 -
 26
26 -
 27
27 -
 28
28 -
 29
29 -
 30
30 -
 31
31 -
 32
32 -
 33
33 -
 34
34 -
 35
35 -
 36
36 -
37
-
38
-
39
-
40
-
41
-
42
-
43
-
44
-
45
-
46
-
47
-
48
-
49
-
50
-
51
-
52
-
53
-
54
-
55
-
56
-
57
-
58
-
59
-
60
-
61
-
62
-
63
-
64
-
65
-
66
-
67
-
68
-
69
-
70
-
71
-
72
-
73
-
74
-
75
-
76
-
77
-
78
-
79
-
80
-
81
-
82
-
83
-
84
-
85
-
86
-
87
-
88
-
89
-
90
-
91
-
92
-
93
-
94
-
95
-
96
-
97
-
98
-
99
-
100
-
101
-
102
-
103
-
104
-
105
-
106
-
107
-
108
-
109
-
110
 |
 |
during fiscal 2005, 2) a curtailment gain of $27 million ($17 million after tax or $0.12 per diluted share) related
to certain amendments made to Sears Canada’s post-retirement benefit plans, and 3) a $20 million ($12 million
after tax or $0.09 per diluted share) dividend we received on our investment in Sears Mexico. In addition, we
recorded investment losses of $14 million ($9 million after tax or $0.06 per diluted share) for fiscal 2007 on our
total return swap investments (see the “Interest and Investment Income” section below for further details).
For fiscal 2006, earnings per share included the following significant items: 1) pre-tax gains of $74 million
($45 million after-tax or $0.29 per diluted share) derived from our investments in total return swaps, 2) a $36
million pre-tax gain ($22 million after-tax or $0.14 per diluted share) recorded by us for the aggregate amount
received by Holdings in June 2006 as part of the settlement of Visa/MasterCard antitrust litigation, 3) a tax
benefit of $31 million ($0.20 per diluted share) related to the resolution of certain income tax matters, and 4) a
pre-tax charge of $74 million ($45 million after-tax or $0.29 per diluted share) related to an unfavorable verdict
in connection with a pre-Merger legal matter concerning Sears Roebuck’s redemption of certain bonds in 2004.
See Note 20 of Notes to Consolidated Financial Statements for further information regarding this matter.
All three fiscal years were impacted by gains recorded on the sale of our assets. These pre-tax gains
amounted to $38 million ($22 million after tax and minority interest or $0.15 per diluted share) in fiscal 2007,
$82 million ($50 million after-tax or $0.32 per diluted share) in fiscal 2006, and $39 million ($25 million
after-tax or $0.16 per diluted share—reported, $25 million after-tax or $0.15 per diluted share—pro forma) in
fiscal 2005. Additionally, fiscal 2006 and 2005 were impacted by restructuring charges. These pre-tax charges
were $28 million ($14 million after-tax or $0.09 per diluted share) in fiscal 2006, and $111 million ($54 million
after-tax or $0.35 per diluted share—reported, $53 million after-tax or $0.33 per diluted share—pro forma) in
fiscal 2005. The charges for both fiscal 2006 and fiscal 2005 were recorded in connection with the Merger and
integration of Sears’ and Kmart’s headquarters support functions, as well as in connection with productivity
initiatives at Sears Canada. Further details pertaining to these restructuring charges are set forth in Note 6 of
Notes to Consolidated Financial Statements.
Fiscal 2005 net income included an after-tax charge of $90 million ($0.59 per diluted share—reported,
$0.55 per diluted share—pro forma) for the cumulative effect of a change in accounting for certain indirect
overhead costs included in inventory. Further details pertaining to this cumulative effect charge are set forth in
Note 3 of Notes to Consolidated Financial Statements.
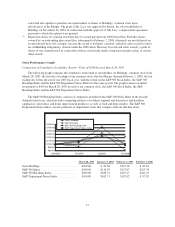
Total Revenues and Comparable Store Sales
Fiscal 2007 domestic comparable store sales were down 4.3% in the aggregate, with Sears Domestic
declining 4.0% and Kmart declining 4.7%. In the current year declines were experienced across most major
merchandise categories reflecting increased competition, the impact of a deteriorating housing market, the
increased costs of consumer staples and a decrease in consumers’ disposable income. In fiscal 2007, notably
larger declines within the home appliance and apparel categories were partially offset by increased sales of
consumer electronics. We believe that the decrease in sales in the home appliance category is directly related to a
25% decrease in new residential housing starts during 2007, as noted by U.S. government census data. We also
believe that the sales decreases reflect the impact of a larger than normal increase in the inflation rate during
2007 (4.1% as measured by the consumer price index), which negatively impacts consumers’ disposable income.
The increase in sales of consumer electronics reflects increased consumer demand and our ability to improve
market share in this category in which the prices of products have increasingly become more commodity based.
For the fourth quarter of fiscal 2007, which includes the holiday selling season, domestic comparable store
sales declined 4.5% in the aggregate, with Sears Domestic and Kmart recording comparable store sales declines
of 4.0% and 5.2%, respectively. Fourth quarter comparable sales results largely reflect the same factors as noted
above. Declines for both the quarter and fiscal year include a more pronounced decline in comparable store sales
in the month of January 2008.
26