Sears 2007 Annual Report Download - page 31
Download and view the complete annual report
Please find page 31 of the 2007 Sears annual report below. You can navigate through the pages in the report by either clicking on the pages listed below, or by using the keyword search tool below to find specific information within the annual report.-
 1
1 -
2
-
3
-
4
-
5
-
6
-
7
-
8
-
9
-
10
-
11
-
12
-
13
-
14
-
15
-
16
-
17
-
18
-
19
-
20
-
 21
21 -
 22
22 -
 23
23 -
 24
24 -
 25
25 -
 26
26 -
 27
27 -
 28
28 -
 29
29 -
 30
30 -
 31
31 -
 32
32 -
 33
33 -
 34
34 -
 35
35 -
 36
36 -
 37
37 -
 38
38 -
 39
39 -
 40
40 -
 41
41 -
42
-
43
-
44
-
45
-
46
-
47
-
48
-
49
-
50
-
51
-
52
-
53
-
54
-
55
-
56
-
57
-
58
-
59
-
60
-
61
-
62
-
63
-
64
-
65
-
66
-
67
-
68
-
69
-
70
-
71
-
72
-
73
-
74
-
75
-
76
-
77
-
78
-
79
-
80
-
81
-
82
-
83
-
84
-
85
-
86
-
87
-
88
-
89
-
90
-
91
-
92
-
93
-
94
-
95
-
96
-
97
-
98
-
99
-
100
-
101
-
102
-
103
-
104
-
105
-
106
-
107
-
108
-
109
-
110
 |
 |

acquired entity is treated as a change in accounting principle. As a result of the accounting change, we recorded a
charge of $90 million, net of taxes, in the first quarter of fiscal 2005 for the cumulative effect of this change in
accounting principle. The charge represents the amount of indirect costs reflected within inventory at the
beginning of fiscal 2005. See Note 3 of Notes to Consolidated Financial Statements for further detail.
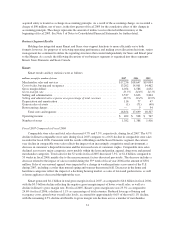
Business Segment Results
Holdings has integrated many Kmart and Sears store-support functions to more efficiently serve both
formats; however, for purposes of reviewing operating performance and making asset-allocation decisions, senior
management has continued to utilize the reporting structures that existed independently for Sears and Kmart prior
to the Merger. As a result, the following discussion of our business segments is organized into three segments:
Kmart, Sears Domestic and Sears Canada.
Kmart
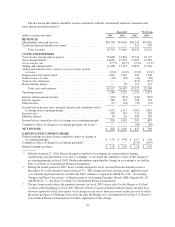
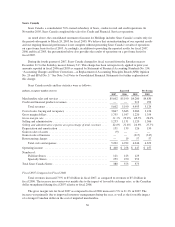
Kmart results and key statistics were as follows:
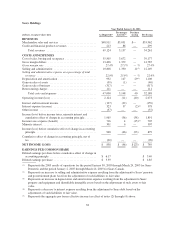
millions, except for number of stores 2007 2006 2005
Merchandise sales and services ........................................ $17,256 $18,647 $19,094
Cost of sales, buying and occupancy .................................... 13,202 14,061 14,462
Gross margin dollars ................................................ 4,054 4,586 4,632
Gross margin rate .................................................. 23.5% 24.6% 24.3%
Selling and administrative ............................................ 3,537 3,623 3,804
Selling and administrative expense as a percentage of total revenues .......... 20.5% 19.4% 19.9%
Depreciation and amortization ......................................... 116 77 47
Gain on sales of assets ............................................... (1) (71) (40)
Restructuring charges ................................................ — 9 54
Total costs and expenses ......................................... 16,854 17,699 18,327
Operating income ................................................... $ 402 $ 948 $ 767
Number of stores ................................................... 1,382 1,388 1,416
Fiscal 2007 Compared to Fiscal 2006
Comparable store sales and total sales decreased 4.7% and 7.5%, respectively, during fiscal 2007. The 4.7%
decline in Kmart comparable store sales during fiscal 2007 compares to a 0.6% decline in comparable store sales
recorded for fiscal 2006. Consistent with the results of Holdings and the Sears Domestic segment, the current
year decline in comparable store sales reflects the impact of an increasingly competitive retail environment, a
decrease in consumer’s disposable income and the increased costs of consumer staples. Comparable store sales
declined across most major categories, most notably within the lawn and garden, apparel, drug store and general
merchandise categories. Total sales for the 52 weeks in fiscal 2007 decreased 7.5%, or $1.4 billion, compared to
53 weeks in fiscal 2006, mainly due to the macroeconomic factors discussed previously. The decrease includes a
decrease related to the impact of sales recorded during the 53rd week of fiscal year 2006 in the amount of $301
million. Sales of our seasonal apparel were impacted by a change in weather patterns across most of the U.S.
during 2007, including a cooler than normal spring and warmer than normal fall. Decreases in the home and
hard-lines categories reflect the impact of a declining housing market, as sales of lawn and garden items, as well
as home appliances decreased throughout the year.
Kmart generated $4.1 billion in total gross margin in fiscal 2007, as compared to $4.6 billion in fiscal 2006,
with the $0.5 billion decline reflecting the negative gross margin impact of lower overall sales, as well as a
decline in Kmart’s gross margin rate. For fiscal 2007, Kmart’s gross margin rate was 23.5% as compared to
24.6% for fiscal 2006, a decline of 1.1% as a percentage of total revenues. Reduced leverage of buying and
occupancy costs, given lower overall sales levels, accounted for approximately 0.6% of the total 1.1% decline,
with the remaining 0.5% decline attributable to gross margin rate declines across a number of merchandise
31