Sears 2007 Annual Report Download - page 24
Download and view the complete annual report
Please find page 24 of the 2007 Sears annual report below. You can navigate through the pages in the report by either clicking on the pages listed below, or by using the keyword search tool below to find specific information within the annual report.-
 1
1 -
2
-
3
-
4
-
5
-
6
-
7
-
8
-
9
-
10
-
11
-
12
-
13
-
 14
14 -
 15
15 -
 16
16 -
 17
17 -
 18
18 -
 19
19 -
 20
20 -
 21
21 -
 22
22 -
 23
23 -
 24
24 -
 25
25 -
 26
26 -
 27
27 -
 28
28 -
 29
29 -
 30
30 -
 31
31 -
 32
32 -
 33
33 -
 34
34 -
35
-
36
-
37
-
38
-
39
-
40
-
41
-
42
-
43
-
44
-
45
-
46
-
47
-
48
-
49
-
50
-
51
-
52
-
53
-
54
-
55
-
56
-
57
-
58
-
59
-
60
-
61
-
62
-
63
-
64
-
65
-
66
-
67
-
68
-
69
-
70
-
71
-
72
-
73
-
74
-
75
-
76
-
77
-
78
-
79
-
80
-
81
-
82
-
83
-
84
-
85
-
86
-
87
-
88
-
89
-
90
-
91
-
92
-
93
-
94
-
95
-
96
-
97
-
98
-
99
-
100
-
101
-
102
-
103
-
104
-
105
-
106
-
107
-
108
-
109
-
110
 |
 |

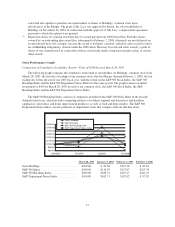
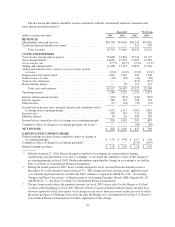
The discussion that follows should be read in conjunction with the consolidated financial statements and
notes thereto included in Item 8.
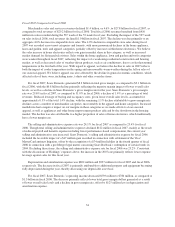
Reported(2) Pro Forma
millions, except per share data 2007 2006 2005 2005(3)
REVENUES
Merchandise sales and services ............................... $50,703 $53,016 $49,242 $53,962
Credit and financial products revenues ......................... — — 213 299
Total revenues ........................................ 50,703 53,016 49,455 54,261
COSTS AND EXPENSES
Cost of sales, buying and occupancy .......................... 36,638 37,824 35,743 39,177
Gross margin dollars ....................................... 14,065 15,192 13,499 14,785
Gross margin rate ......................................... 27.7% 28.7% 27.4% 27.4%
Selling and administrative ................................... 11,468 11,574 10,892 12,149
Selling and administrative expense as a percentage of total
revenues ............................................... 22.6% 21.8% 22.0% 22.4%
Depreciation and amortization ............................... 1,049 1,143 942 1,108
Gain on sales of assets ...................................... (38) (82) (39) (40)
Gain on sale of business .................................... — — (317) (317)
Restructuring charges ...................................... — 28 111 111
Total costs and expenses ................................ 49,117 50,487 47,332 52,188
Operating income ......................................... 1,586 2,529 2,123 2,073
Interest and investment income ............................... (135) (253) (130) (159)
Interest expense ........................................... 286 335 328 378
Other income ............................................. (17) (24) (37) (37)
Income before income taxes, minority interest and cumulative effect
of change in accounting principle ........................... 1,452 2,471 1,962 1,891
Income taxes ............................................. 550 933 715 705
Minority interest .......................................... 76 46 300 307
Income before cumulative effect of change in accounting principle . . 826 1,492 947 879
Cumulative effect of change in accounting principle, net of tax(1) .... — — (90) (90)
NET INCOME $ 826 $ 1,492 $ 857 $ 789
EARNINGS PER COMMON SHARE
Diluted earnings per share before cumulative effect of change in
accounting principle ..................................... $ 5.70 $ 9.58 $ 6.17 $ 5.40
Cumulative effect of change in accounting principle(1) ............ — — (0.59) (0.55)
Diluted earnings per share ................................... $ 5.70 $ 9.58 $ 5.58 $ 4.85
(1) Effective January 27, 2005, Kmart changed its method of accounting for certain indirect buying,
warehousing and distribution costs and, accordingly, we recorded the cumulative effect of this change in
accounting principle in fiscal 2005. Further information regarding this change in accounting is set forth in
Note 3 of Notes to Consolidated Financial Statements.
(2) During the fourth quarter of 2007, Sears Canada changed its fiscal year end from the Saturday nearest
December 31st to the Saturday nearest January 31st. This change has been retrospectively applied to prior
year amounts reported in the fiscal 2006 and 2005 columns as required by SFAS No. 154, “Accounting
Changes and Error Corrections—A Replacement of Accounting Principles Board (APB) Opinion No. 20
and SFAS No. 3.” See Note 3 of Notes to Consolidated Financial Statements.
(3) The pro forma results adjust the reported amounts for fiscal 2005 to give effect to the Merger as if it had
occurred at the beginning of fiscal 2005. Results of Sears Canada included in the pro forma amounts have
not been updated to reflect the impact of its change in year end as these pro forma results are used to reflect
the future prospects of Holdings assessed at the time the Merger was consummated. See Note 3 of Notes to
Consolidated Financial Statements for further explanation of this change.
24