Sears 2007 Annual Report Download - page 77
Download and view the complete annual report
Please find page 77 of the 2007 Sears annual report below. You can navigate through the pages in the report by either clicking on the pages listed below, or by using the keyword search tool below to find specific information within the annual report.-
 1
1 -
2
-
3
-
4
-
5
-
6
-
7
-
8
-
9
-
10
-
11
-
12
-
13
-
14
-
15
-
16
-
17
-
18
-
19
-
20
-
21
-
22
-
23
-
24
-
25
-
26
-
27
-
28
-
29
-
30
-
31
-
32
-
33
-
34
-
35
-
36
-
37
-
38
-
39
-
40
-
41
-
42
-
43
-
44
-
45
-
46
-
47
-
48
-
49
-
50
-
51
-
52
-
53
-
54
-
55
-
56
-
57
-
58
-
59
-
60
-
61
-
62
-
63
-
64
-
65
-
66
-
 67
67 -
 68
68 -
 69
69 -
 70
70 -
 71
71 -
 72
72 -
 73
73 -
 74
74 -
 75
75 -
 76
76 -
 77
77 -
 78
78 -
 79
79 -
 80
80 -
 81
81 -
 82
82 -
 83
83 -
 84
84 -
 85
85 -
 86
86 -
 87
87 -
88
-
89
-
90
-
91
-
92
-
93
-
94
-
95
-
96
-
97
-
98
-
99
-
100
-
101
-
102
-
103
-
104
-
105
-
106
-
107
-
108
-
109
-
110
 |
 |

SEARS HOLDINGS CORPORATION
Notes to Consolidated Financial Statements—(Continued)
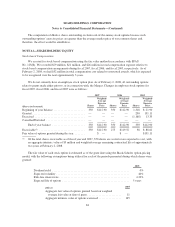
The performance guarantee relates to certain municipal bonds issued in connection with our headquarters
building. This guarantee expired in 2007. Payments during the 2007 under this guarantee, before expiration, were
$17 million.
In addition, in November 2005, Holdings issued a call option to the private equity fund of Ares Management
LLC (“Ares”) in connection with Ares’ 19.9% investment in the voting stock of OSH. Ares paid us $59 million
in cash for the 19.9% equity interest and the call option, a three-year option to purchase, for $137 million,
additional shares in OSH that represented 30.2% of OSH’s outstanding voting stock at the time of the option’s
issuance. We have recorded the fair value of this option as a liability on our consolidated balance sheet, and
changes in the fair value of the option have been recorded as a component of other income in our consolidated
statement of income.
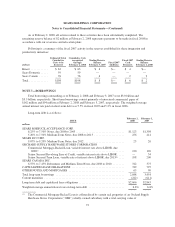
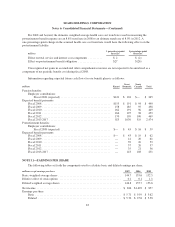
NOTE 9—INTEREST AND INVESTMENT INCOME
The following table sets forth the components of interest and investment income as reported in our
consolidated statements of income.
millions 2007 2006 2005
Interest income on cash and cash equivalents .................. $107 $150 $ 87
Total return swap (loss) income ............................ (14) 74 —
Other investment income ................................. 42 29 43
Total ................................................. $135 $253 $130
Interest Income on Cash and Cash Equivalents
We recorded interest income of $107 million, $150 million, and $87 million for fiscal 2007, fiscal 2006 and
fiscal 2005, respectively, primarily related to interest earned on cash and cash equivalents. These cash and cash
equivalents include all highly liquid investments with original maturities of three months or less at the date of
purchase. Our invested cash may include, from time to time, investments in, but not limited to, commercial
paper, U.S. federal, state and municipal government securities, floating-rate notes, repurchase agreements and
money market funds. All invested cash amounts are readily available to us.
Total Return Swap Income
As discussed above in Note 8, from time to time we invest our surplus cash in various securities and
financial instruments, including total return swaps. During fiscal 2007, we recognized investment losses of $14
million on these total return swaps. During fiscal 2006, we recognized $74 million of investment income on total
return swaps.
Other Investment Income
Other investment income primarily includes income generated by (and sales of investments in) certain real
estate joint ventures and other equity investments in which we do not have a controlling interest.
77