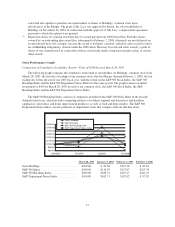
Sears 2007 Annual Report Download - page 25
Download and view the complete annual report
Please find page 25 of the 2007 Sears annual report below. You can navigate through the pages in the report by either clicking on the pages listed below, or by using the keyword search tool below to find specific information within the annual report.-
 1
1 -
2
-
3
-
4
-
5
-
6
-
7
-
8
-
9
-
10
-
11
-
12
-
13
-
14
-
 15
15 -
 16
16 -
 17
17 -
 18
18 -
 19
19 -
 20
20 -
 21
21 -
 22
22 -
 23
23 -
 24
24 -
 25
25 -
 26
26 -
 27
27 -
 28
28 -
 29
29 -
 30
30 -
 31
31 -
 32
32 -
 33
33 -
 34
34 -
 35
35 -
36
-
37
-
38
-
39
-
40
-
41
-
42
-
43
-
44
-
45
-
46
-
47
-
48
-
49
-
50
-
51
-
52
-
53
-
54
-
55
-
56
-
57
-
58
-
59
-
60
-
61
-
62
-
63
-
64
-
65
-
66
-
67
-
68
-
69
-
70
-
71
-
72
-
73
-
74
-
75
-
76
-
77
-
78
-
79
-
80
-
81
-
82
-
83
-
84
-
85
-
86
-
87
-
88
-
89
-
90
-
91
-
92
-
93
-
94
-
95
-
96
-
97
-
98
-
99
-
100
-
101
-
102
-
103
-
104
-
105
-
106
-
107
-
108
-
109
-
110
 |
 |

Fiscal 2007 Summary
The following discussion is designed to provide the reader with an overview of fiscal 2007 financial results,
with particular emphasis on significant events and transactions that had a disproportionate effect on our results
for the fiscal years presented. Further discussion regarding the operating performance of both Holdings and our
business segments follows this overview section. This discussion should be read in conjunction with our financial
statements and accompanying notes as of February 2, 2008, and the year then ended.
Net Income
For fiscal 2007, net income was $826 million compared with net income of $1.5 billion in fiscal 2006. The
decrease in net income for the year reflects lower operating results at both Sears Domestic and Kmart, partially
offset by improved operating results at Sears Canada. Declines in the operating results of Sears Domestic and
Kmart are primarily the result of a decline in gross margin across most major merchandise categories, reflecting
both sales declines, as well as an overall decline in our gross margin rate for the year. Interest and investment
income also declined during the year as we settled our investments in total return swaps during the third quarter.
The negative impact of these declines on our fiscal 2007 results was only partially offset by declines in selling,
general and administrative expenses, depreciation and amortization, income tax expense (given lower levels of
pre-tax income in fiscal 2007), and reduced interest expense (given lower average outstanding borrowings).
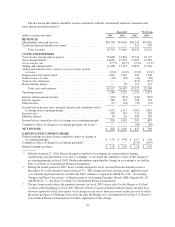
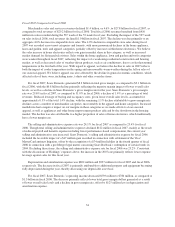
Earnings per Diluted Share and Significant Items
The table below sets forth earnings per share results for our most recent three fiscal years, reflected on both
a reported and pro forma basis for fiscal 2005 as explained above. Net income and earnings per diluted share
results for all three fiscal years were impacted by certain significant items. The magnitude of such items may
vary significantly from period to period and, thereby, have a disproportionate effect on earnings for any given
period, affecting the comparability of our financial performance. Accordingly, management considers the
aggregate impact of these items, along with reported results, in reviewing and evaluating our financial
performance.
The impact of these items on diluted earnings per share is presented in the following table:
Reported Pro Forma
2007 2006 2005 2005
Earnings per diluted share ....................................... $5.70 $ 9.58 $ 5.58 $ 4.85
Less:
Hurricane related recoveries ................................. 0.08 — — —
Gain on sales of assets ...................................... 0.15 0.32 0.16 0.15
Sears Canada post-retirement benefit plans curtailment gain ........ 0.12 — — —
Dividend—investment in Sears Mexico ........................ 0.09 — — —
Total return swap income (loss) .............................. (0.06) 0.29 — —
Visa/MasterCard settlement ................................. — 0.14 — —
Income tax settlements ..................................... — 0.20 — —
Legal matter—AIG Annuity Insurance Co., et al v. Sears Roebuck . . — (0.29) — —
Restructuring charges ...................................... — (0.09) (0.35) (0.33)
Cumulative effect of change in accounting ...................... — — (0.59) (0.55)
Earnings per diluted share excluding above items .................... $5.32 $ 9.01 $ 6.36 $ 5.58
During fiscal 2007, we recognized 1) a gain of $19 million ($12 million after tax or $0.08 per diluted share)
for insurance recoveries received on hurricane claims filed for certain of our property damaged by hurricanes
25