Redbox 2008 Annual Report Download - page 68
Download and view the complete annual report
Please find page 68 of the 2008 Redbox annual report below. You can navigate through the pages in the report by either clicking on the pages listed below, or by using the keyword search tool below to find specific information within the annual report.-
 1
1 -
2
-
3
-
4
-
5
-
6
-
7
-
8
-
9
-
10
-
11
-
12
-
13
-
14
-
15
-
16
-
17
-
18
-
19
-
20
-
21
-
22
-
23
-
24
-
25
-
26
-
27
-
28
-
29
-
30
-
31
-
32
-
33
-
34
-
35
-
36
-
37
-
38
-
39
-
40
-
41
-
42
-
43
-
44
-
45
-
46
-
47
-
48
-
49
-
50
-
51
-
52
-
53
-
54
-
55
-
56
-
57
-
 58
58 -
 59
59 -
 60
60 -
 61
61 -
 62
62 -
 63
63 -
 64
64 -
 65
65 -
 66
66 -
 67
67 -
 68
68 -
 69
69 -
 70
70 -
 71
71 -
 72
72 -
 73
73 -
 74
74 -
 75
75 -
 76
76 -
 77
77 -
 78
78 -
79
-
80
-
81
-
82
-
83
-
84
-
85
-
86
-
87
-
88
-
89
-
90
-
91
-
92
-
93
-
94
-
95
-
96
-
97
-
98
-
99
-
100
-
101
-
102
-
103
-
104
-
105
-
106
-
107
-
108
-
109
-
110
-
111
-
112
-
113
-
114
-
115
-
116
-
117
-
118
-
119
-
120
-
121
-
122
-
123
-
124
-
125
-
126
-
127
-
128
-
129
-
130
-
131
-
132
 |
 |

resulted in excess equipment and inventory. As a result, we recorded a non-cash impairment charge of $52.6 million
or approximately 50% of the net book value of our entertainment machines related to the impairment of these
cranes, bulk heads, and kiddie rides in the year ended December 31, 2007.
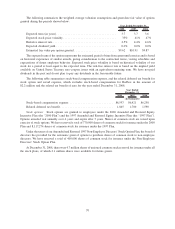
NOTE 5: INTANGIBLE ASSETS
The gross carrying amounts and related accumulated amortization as well as the range of estimated useful lives
of identifiable intangible assets at the reported balance sheet dates were as follows:
Range of
Estimated
Useful Lives
(in years)
Estimated
Weighted
Average
Useful Lives
(in years)
Gross
Amount
Accumulated
Amortization
Gross
Amount
Accumulated
Amortization
2008 2007
(In thousands)
December 31,
Intangible assets:
Retailer and agent
relationships .......... 3-10 9.17 $57,661 $(23,287) $44,005 $(17,180)
Other identifiable intangible
assets................ 1-40 8.02 13,765 (4,754) 10,686 (3,054)
Total .................... $71,426 $(28,041) $54,691 $(20,234)
Based on identifiable intangible assets recorded as of December 31, 2008, and assuming no subsequent
impairment of the underlying assets, the annual estimated aggregate future amortization expenses are as follows:
(In thousands)
2009 ............................................................. $ 9,004
2010 ............................................................. 8,278
2011 ............................................................. 6,562
2012 ............................................................. 6,172
2013 ............................................................. 4,825
Thereafter ......................................................... 8,544
$43,385
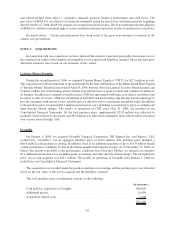
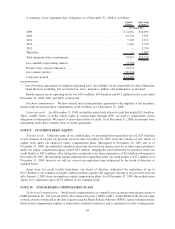
NOTE 6: ACCRUED LIABILITIES
Accrued liabilities consisted of the following as of December 31:
2008 2007
(In thousands)
Payroll related expenses ......................................... $25,460 $12,442
Interest payable ............................................... 2,268 616
Taxes payable ................................................. 16,758 4,068
Accrued rent .................................................. 12,981 —
Accrued professional fees ........................................ 3,697 1,659
Service contract providers ........................................ 5,031 5,451
Accrued medical insurance ....................................... 1,564 1,951
Payable to related party for telecommunication fee refund ................ — 5,547
Accrued acquisition costs ........................................ 10,000 —
Interest rate swap .............................................. 7,467 —
Other ....................................................... 12,261 9,177
$97,487 $40,911
66