Redbox 2008 Annual Report Download - page 31
Download and view the complete annual report
Please find page 31 of the 2008 Redbox annual report below. You can navigate through the pages in the report by either clicking on the pages listed below, or by using the keyword search tool below to find specific information within the annual report.-
 1
1 -
2
-
3
-
4
-
5
-
6
-
7
-
8
-
9
-
10
-
11
-
12
-
13
-
14
-
15
-
16
-
17
-
18
-
19
-
20
-
 21
21 -
 22
22 -
 23
23 -
 24
24 -
 25
25 -
 26
26 -
 27
27 -
 28
28 -
 29
29 -
 30
30 -
 31
31 -
 32
32 -
 33
33 -
 34
34 -
 35
35 -
 36
36 -
 37
37 -
 38
38 -
 39
39 -
 40
40 -
 41
41 -
42
-
43
-
44
-
45
-
46
-
47
-
48
-
49
-
50
-
51
-
52
-
53
-
54
-
55
-
56
-
57
-
58
-
59
-
60
-
61
-
62
-
63
-
64
-
65
-
66
-
67
-
68
-
69
-
70
-
71
-
72
-
73
-
74
-
75
-
76
-
77
-
78
-
79
-
80
-
81
-
82
-
83
-
84
-
85
-
86
-
87
-
88
-
89
-
90
-
91
-
92
-
93
-
94
-
95
-
96
-
97
-
98
-
99
-
100
-
101
-
102
-
103
-
104
-
105
-
106
-
107
-
108
-
109
-
110
-
111
-
112
-
113
-
114
-
115
-
116
-
117
-
118
-
119
-
120
-
121
-
122
-
123
-
124
-
125
-
126
-
127
-
128
-
129
-
130
-
131
-
132
 |
 |
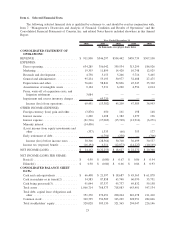
Critical Accounting Policies and Estimates
Our discussion and analysis of our financial condition and results of operations is based upon our Consolidated
Financial Statements and related notes, which have been prepared in accordance with accounting principles
generally accepted in the United States of America (“GAAP”). The preparation of these financial statements
requires us to make estimates and assumptions that affect the reported amounts of assets, liabilities, revenue and
expenses, and related disclosure of contingent assets and liabilities. We evaluate our estimates on an ongoing basis.
Our estimates are based on historical experience and on various other assumptions that are believed to be reasonable
under the circumstances, the results of which form the basis for making judgments about the carrying values of
assets and liabilities that are not readily apparent from other sources. Actual results may differ from these estimates
under different assumptions or conditions.
Revenue recognition: We recognize revenue as follows:
• Coin-counting revenue, which is collected from either consumers or card issuers (in stored value card or
e-certificate transactions), is recognized at the time the consumers’ coins are counted by our coin-counting
machines. Cash deposited in machines that has not yet been collected is referred to as cash in machine and is
reported in our consolidated balance sheet under the caption “Cash in machine or in transit”. Our revenue
represents the fee charged for coin-counting;
• DVD revenue is recognized during the term of a customer’s rental transaction or purchase and is recorded net
of applicable sales taxes;
• Money transfer revenue represents the commissions earned on a money transfer transaction and is
recognized at the time the customer completes the transaction;
• Entertainment revenue is recognized at the time cash is deposited in our machines. Cash deposited in the
machines that has not yet been collected is referred to as cash in machine and is estimated at period end and
reported on the balance sheet under the caption “Cash in machine or in transit”. This estimate is based on the
average daily revenue per machine, multiplied by the number of days since the coin in the machine has been
collected. The estimated value of our entertainment services coin-in-machine was approximately $3.0 mil-
lion and $8.4 million at December 31, 2008 and December 31, 2007, respectively;
• E-payment revenue is recognized at the point of sale based on our commissions earned, net of retailer fees.
Purchase price allocations: In connection with our acquisitions in 2008, 2007 and 2006, we have allocated
the respective purchase prices plus transaction costs to the estimated fair values of assets acquired and liabilities
assumed. These purchase price allocations were based on our estimates of fair values. Adjustments to our purchase
price allocation estimates are made based on our final analysis of the fair value during the allocation period, which is
within one year of the purchase date.
Goodwill and intangible assets: Goodwill represents the excess of cost over the estimated fair value of net
assets acquired, which is not being amortized. We test goodwill for impairment at the reporting unit level on an
annual or more frequent basis as determined necessary. FASB Statement No. 142, Goodwill and Other Intangible
Assets (“SFAS 142”) requires a two-step goodwill impairment test whereby the first step, used to identify potential
impairment, compares the fair value of a reporting unit with its carrying amount including goodwill. If the fair value
of a reporting unit exceeds its carrying amount, goodwill of the reporting unit is considered not impaired and the
second test is not performed. The second step of the impairment test is performed when required and compares the
implied fair value of the reporting unit goodwill with the carrying amount of that goodwill. If the carrying amount of
the reporting unit goodwill exceeds the implied fair value of that goodwill, an impairment loss shall be recognized
in an amount equal to that excess.
We are currently organized into four reportable business segments: Coin and Entertainment services, DVD
services, Money Transfer services and E-payment services. Prior to January 1, 2008 we were organized into two
reportable business segments: the North American business (which included the United States, Canada, Mexico and
Puerto Rico) and the International business (which primarily included the United Kingdom as well as other
European operations of our Coinstar Money Transfer subsidiary). Based on the annual goodwill test for impairment
we performed for the years ended December 31, 2008 and 2007, we determined there was no impairment of our
29