Redbox 2008 Annual Report Download - page 35
Download and view the complete annual report
Please find page 35 of the 2008 Redbox annual report below. You can navigate through the pages in the report by either clicking on the pages listed below, or by using the keyword search tool below to find specific information within the annual report.-
 1
1 -
2
-
3
-
4
-
5
-
6
-
7
-
8
-
9
-
10
-
11
-
12
-
13
-
14
-
15
-
16
-
17
-
18
-
19
-
20
-
21
-
22
-
23
-
24
-
 25
25 -
 26
26 -
 27
27 -
 28
28 -
 29
29 -
 30
30 -
 31
31 -
 32
32 -
 33
33 -
 34
34 -
 35
35 -
 36
36 -
 37
37 -
 38
38 -
 39
39 -
 40
40 -
 41
41 -
 42
42 -
 43
43 -
 44
44 -
 45
45 -
46
-
47
-
48
-
49
-
50
-
51
-
52
-
53
-
54
-
55
-
56
-
57
-
58
-
59
-
60
-
61
-
62
-
63
-
64
-
65
-
66
-
67
-
68
-
69
-
70
-
71
-
72
-
73
-
74
-
75
-
76
-
77
-
78
-
79
-
80
-
81
-
82
-
83
-
84
-
85
-
86
-
87
-
88
-
89
-
90
-
91
-
92
-
93
-
94
-
95
-
96
-
97
-
98
-
99
-
100
-
101
-
102
-
103
-
104
-
105
-
106
-
107
-
108
-
109
-
110
-
111
-
112
-
113
-
114
-
115
-
116
-
117
-
118
-
119
-
120
-
121
-
122
-
123
-
124
-
125
-
126
-
127
-
128
-
129
-
130
-
131
-
132
 |
 |

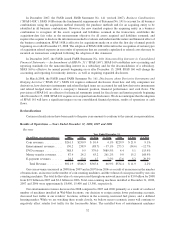
decreased to approximately 145,000 at December 31, 2008, from approximately 280,000 at December 31, 2007 and
301,000 at December 31, 2006 primarily due to our agreement with Wal-Mart to significantly expand our installed
coin-counting and DVD machines while reducing our installed entertainment machines. In addition, we are also
reducing our installed base as a result of strategic decisions to resign from certain lower performing accounts.
Our DVD revenues increased in 2008 compared to 2007 primarily as a result of our increased ownership
percentage of Redbox, which, as a result required the consolidation of Redbox’s results from the effective
transaction date of January 18, 2008. Revenues for Redbox for the period from January 18 to December 31, 2008
were $375.8 million. Total installed kiosks increased to approximately 13,700 at December 31, 2008 from 7,000
and 2,200 at December 31, 2007 and December 31, 2006, respectively. The increase in DVD revenues in 2007 from
2006 was primarily due to the growth in DVDXpress, our wholly-owned subsidiary.
Our Money Transfer services revenues increased in 2008 compared to 2007 primarily as a result of the
acquisition of GroupEx effective January 1, 2008, an increase in the number of money transfer transactions, and an
increase in the average amount per transaction. Revenues for GroupEx for 2008 were $54.4 million. The increase in
Money transfer revenue in 2007 from 2006 was due to increased transactions, which was the result of a full year of
revenue in 2007 from CMT, which we acquired in the second quarter of 2006.
Our E-payment revenues increased in 2008 compared to 2007 and 2006 as a result of an increase in the amount
of transactions and the number of locations offering our E-payment services. Total point-of-sale terminals were
23,000 at December 31, 2008, compared to approximately 17,500 at December 31, 2007 and 14,500 at Decem-
ber 31, 2006.
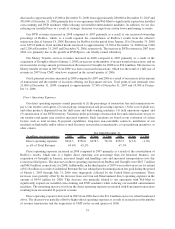
Direct Operating Expenses
Our direct operating expenses consist primarily of (1) the percentage of transaction fees and commissions we
pay to our retailers and agents, (2) coin pick-up, transportation and processing expenses, (3) the cost of plush toys
and other products dispensed from the skill-crane and bulk-vending machines, (4) field operations support and
(5) amortization of our DVD inventory. Variations in the percentage of transaction fees and commissions we pay to
our retailers and agents may result in increased expenses. Such variations are based on our evaluation of certain
factors, such as total revenue, E-payment capabilities, long-term non-cancelable contracts, installation of our
machines in high traffic and/or urban or rural locations, new product commitments, co-op marketing incentives, or
other criteria.
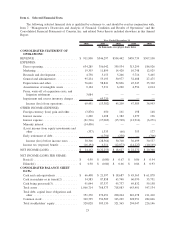
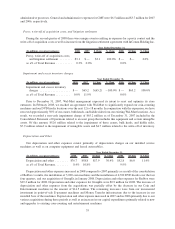
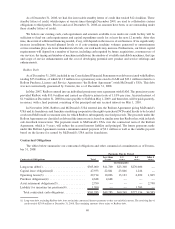
(In millions, except percentages) 2008 2007 $ Chng % Chng 2006 $ Chng % Chng
Year Ended December 31,
Direct operating expenses . . . $634.3 $356.0 $278.3 78.2% $359.5 $(3.5) ⫺1.0%
as a% of Total Revenue .... 69.6% 65.2% 67.3%
Direct operating expenses increased in 2008 compared to 2007 primarily as a result of the consolidation of
Redbox’s results, which runs at a higher direct operating cost percentage than our historical business, our
acquisition of GroupEx in January, increased freight and handling costs and increased transportation costs due
to increased fuel prices. The increases in direct operating expenses from Redbox and GroupEx were $267.7 million
and $44.0 million, respectively, for 2008. Additionally, in the third quarter of 2007 we recorded an excise tax refund
of $11.8 million as a result of an Internal Revenue Service ruling that telecommunication fees paid during the period
of March 1, 2003 through July 31, 2006 were improperly collected by the United States government. These
increases were partially offset by the decrease from our Coin and Entertainment direct operating expenses in the
amount of $54.9 million for 2008. This decrease was primarily related to our agreement with Wal-Mart to
significantly expand our installed coin-counting and DVD machines while reducing our installed entertainment
machines. The remaining increase was from the direct operating expenses associated with E-payment transactions
resulting from incremental E-payment revenue.
Direct operating expenses decreased in 2007 from 2006 due to the $11.8 million excise tax refund mentioned
above. The decrease was partially offset by higher direct operating expenses as a result of an increase in the number
of revenue transactions and the acquisition of CMT in the second quarter of 2006.
33