Redbox 2008 Annual Report Download - page 37
Download and view the complete annual report
Please find page 37 of the 2008 Redbox annual report below. You can navigate through the pages in the report by either clicking on the pages listed below, or by using the keyword search tool below to find specific information within the annual report.-
 1
1 -
2
-
3
-
4
-
5
-
6
-
7
-
8
-
9
-
10
-
11
-
12
-
13
-
14
-
15
-
16
-
17
-
18
-
19
-
20
-
21
-
22
-
23
-
24
-
25
-
26
-
 27
27 -
 28
28 -
 29
29 -
 30
30 -
 31
31 -
 32
32 -
 33
33 -
 34
34 -
 35
35 -
 36
36 -
 37
37 -
 38
38 -
 39
39 -
 40
40 -
 41
41 -
 42
42 -
 43
43 -
 44
44 -
 45
45 -
 46
46 -
 47
47 -
48
-
49
-
50
-
51
-
52
-
53
-
54
-
55
-
56
-
57
-
58
-
59
-
60
-
61
-
62
-
63
-
64
-
65
-
66
-
67
-
68
-
69
-
70
-
71
-
72
-
73
-
74
-
75
-
76
-
77
-
78
-
79
-
80
-
81
-
82
-
83
-
84
-
85
-
86
-
87
-
88
-
89
-
90
-
91
-
92
-
93
-
94
-
95
-
96
-
97
-
98
-
99
-
100
-
101
-
102
-
103
-
104
-
105
-
106
-
107
-
108
-
109
-
110
-
111
-
112
-
113
-
114
-
115
-
116
-
117
-
118
-
119
-
120
-
121
-
122
-
123
-
124
-
125
-
126
-
127
-
128
-
129
-
130
-
131
-
132
 |
 |

administrative processes. General and administrative expenses for CMTwere $6.5 million and $3.7 million for 2007
and 2006, respectively.
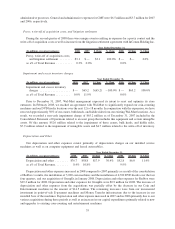
Proxy, write-off of acquisition costs, and litigation settlement
During the second quarter of 2008 there were unique events resulting in expenses for a proxy contest and the
write-off of acquisition costs as well as income from the litigation settlement agreement with InComm Holding Inc.
(In millions, except percentages) 2008 2007 $ Chng % Chng 2006 $ Chng % Chng
Year Ended December 31,
Proxy, write-off of acquisition costs,
and litigation settlement ........ $3.1 $ — $3.1 100.0% $ — $— 0.0%
as a% of Total Revenue .......... 0.3% 0.0% 0.0%
Impairment and excess inventory charges
(In millions, except percentages) 2008 2007 $ Chng % Chng 2006 $ Chng % Chng
Year Ended December 31,
Impairment and excess inventory
charges ................... $— $65.2 $(65.2) ⫺100.0% $ — $65.2 100.0%
as a% of Total Revenue ......... 0.0% 11.9% 0.0%
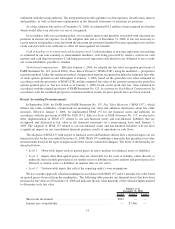
Prior to December 31, 2007, Wal-Mart management expressed its intent to reset and optimize its store
entrances. In February 2008, we reached an agreement with Wal-Mart to significantly expand our coin-counting
machines and our DVD kiosks locations over the next 12 to 18 months. In conjunction with the expansion, we have
removed approximately 50% of our cranes, bulk heads, and kiddie rides from our existing Wal-Mart locations. As a
result, we recorded a non-cash impairment charge of $65.2 million as of December 31, 2007 included in the
Consolidated Statement of Operations related to an asset group that includes this equipment and certain intangible
assets. Of this amount, $52.6 million related to the impairment of these cranes, bulk heads, and kiddie rides,
$7.9 million related to the impairment of intangible assets and $4.7 million related to the write-off of inventory.
Depreciation and Other
Our depreciation and other expenses consist primarily of depreciation charges on our installed service
machines as well as on computer equipment and leased automobiles.
(In millions, except percentages) 2008 2007 $ Chng % Chng 2006 $ Chng % Chng
Year Ended December 31,
Depreciation and other ........ $76.7 $58.8 $17.9 30.4% $52.8 $6.0 11.4%
as a% of Total Revenue ........ 8.4% 10.8% 9.9%
Depreciation and other expenses increased in 2008 compared to 2007 primarily as a result of the consolidation
of Redbox’s results, the installation of 3,000 coin machines and the installation of 6,700 DVD kiosks over the last
four quarters, and our acquisition of GroupEx in January 2008. Depreciation and other expenses for Redbox were
$29.2 million for 2008. Depreciation and other expenses for GroupEx were $0.9 million for 2008. The increase of
depreciation and other expenses from the acquisitions was partially offset by the decrease in our Coin and
Entertainment machines in the amount of $14.5 million. The remaining increases were from our incremental
investment in point-of-sale E-payment machines and Money Transfer infrastructure due to the increase in our
installed base of the machines. Depreciation and other expense increased in 2007 and in 2006 primarily due to our
various acquisitions during these periods as well as an increase in our capital expenditures primarily related to new
and upgrades to existing coin-counting and entertainment machines.
35