Redbox 2008 Annual Report Download - page 25
Download and view the complete annual report
Please find page 25 of the 2008 Redbox annual report below. You can navigate through the pages in the report by either clicking on the pages listed below, or by using the keyword search tool below to find specific information within the annual report.
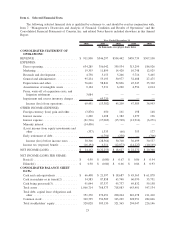
Item 6. Selected Financial Data.
The following selected financial data is qualified by reference to, and should be read in conjunction with,
Item 7. “Management’s Discussion and Analysis of Financial Condition and Results of Operations” and the
Consolidated Financial Statements of Coinstar, Inc. and related Notes thereto included elsewhere in this Annual
Report.
2008 2007 2006 2005 2004
Year Ended December 31,
(In thousands, except per share data)
CONSOLIDATED STATEMENT OF
OPERATIONS:
REVENUE . . . ....................... $ 911,900 $546,297 $534,442 $459,739 $307,100
EXPENSES:
Direct operating ..................... 634,285 356,042 359,534 313,299 186,926
Marketing . . ....................... 19,303 11,899 14,420 10,748 12,925
Research and development ............. 4,758 5,153 5,246 5,716 5,465
General and administrative ............. 95,234 55,193 50,977 32,488 27,475
Depreciation and other ................ 76,661 58,841 52,836 45,347 35,302
Amortization of intangible assets ........ 9,124 7,331 6,220 4,556 2,014
Proxy, write-off of acquisition costs, and
litigation settlement ................ 3,084 ————
Impairment and excess inventory charges . . — 65,220 — — —
Income (loss) from operations ......... 69,451 (13,382) 45,209 47,585 36,993
OTHER INCOME (EXPENSE):
Foreign currency (loss) gain and other .... (3,876) 650 161 198 148
Interest income ..................... 1,220 1,698 1,382 1,279 196
Interest expense ..................... (21,716) (17,069) (15,748) (12,916) (6,271)
Minority interest .................... (14,436) ————
(Loss) income from equity investments and
other ........................... (337) 1,333 (66) 353 177
Early retirement of debt ............... — (1,794) (238) — (706)
Income (loss) before income taxes ..... 30,306 (28,564) 30,700 36,499 30,537
Income tax (expense) benefit ........... (16,194) 6,311 (12,073) (14,227) (10,169)
NET INCOME (LOSS) ................. $ 14,112 $ (22,253) $ 18,627 $ 22,272 $ 20,368
NET INCOME (LOSS) PER SHARE:
Basic(1) ........................... $ 0.50 $ (0.80) $ 0.67 $ 0.86 $ 0.94
Diluted(1) . . ....................... $ 0.50 $ (0.80) $ 0.66 $ 0.86 $ 0.93
CONSOLIDATED BALANCE SHEET
DATA:
Cash and cash equivalents ............. $ 66,408 $ 21,397 $ 18,687 $ 45,365 $ 61,878
Cash in machine or in transit(2) ......... 34,583 87,858 63,740 60,070 35,751
Cash being processed(3) ............... 91,044 87,337 95,737 69,832 59,158
Total assets . ....................... 1,066,714 768,573 718,083 643,401 547,134
Total debt, capital lease obligations and
other ........................... 351,370 272,651 200,264 210,478 211,410
Common stock ...................... 369,735 354,509 343,229 328,951 282,046
Total stockholders’ equity.............. 320,028 305,130 321,365 294,047 226,146
23


