Redbox 2008 Annual Report Download - page 34
Download and view the complete annual report
Please find page 34 of the 2008 Redbox annual report below. You can navigate through the pages in the report by either clicking on the pages listed below, or by using the keyword search tool below to find specific information within the annual report.-
 1
1 -
2
-
3
-
4
-
5
-
6
-
7
-
8
-
9
-
10
-
11
-
12
-
13
-
14
-
15
-
16
-
17
-
18
-
19
-
20
-
21
-
22
-
23
-
 24
24 -
 25
25 -
 26
26 -
 27
27 -
 28
28 -
 29
29 -
 30
30 -
 31
31 -
 32
32 -
 33
33 -
 34
34 -
 35
35 -
 36
36 -
 37
37 -
 38
38 -
 39
39 -
 40
40 -
 41
41 -
 42
42 -
 43
43 -
 44
44 -
45
-
46
-
47
-
48
-
49
-
50
-
51
-
52
-
53
-
54
-
55
-
56
-
57
-
58
-
59
-
60
-
61
-
62
-
63
-
64
-
65
-
66
-
67
-
68
-
69
-
70
-
71
-
72
-
73
-
74
-
75
-
76
-
77
-
78
-
79
-
80
-
81
-
82
-
83
-
84
-
85
-
86
-
87
-
88
-
89
-
90
-
91
-
92
-
93
-
94
-
95
-
96
-
97
-
98
-
99
-
100
-
101
-
102
-
103
-
104
-
105
-
106
-
107
-
108
-
109
-
110
-
111
-
112
-
113
-
114
-
115
-
116
-
117
-
118
-
119
-
120
-
121
-
122
-
123
-
124
-
125
-
126
-
127
-
128
-
129
-
130
-
131
-
132
 |
 |

In December 2007, the FASB issued FASB Statement No. 141 (revised 2007), Business Combinations
(“SFAS 141R”). SFAS 141R retains the fundamental requirements of Statement No. 141 to account for all business
combinations using the acquisition method (formerly the purchase method) and for an acquiring entity to be
identified in all business combinations. However, the new standard requires the acquiring entity in a business
combination to recognize all the assets acquired and liabilities assumed in the transaction; establishes the
acquisition-date fair value as the measurement objective for all assets acquired and liabilities assumed; and
requires the acquirer to disclose the information needed to evaluate and understand the nature and financial effect of
the business combination. SFAS 141R is effective for acquisitions made on or after the first day of annual periods
beginning on or after December 15, 2008. The adoption of SFAS 141R will result in the recognition of certain types
of acquisition related expenses in our results of operations that are currently capitalized or related costs that may be
incurred on transactions completed following the adoption of this statement.
In December 2007, the FASB issued FASB Statement No. 160, Noncontrolling Interests in Consolidated
Financial Statements — An Amendment of ARB No. 51 (“SFAS 160”). SFAS 160 establishes new accounting and
reporting standards for the noncontrolling interest in a subsidiary and for the deconsolidation of a subsidiary.
SFAS 160 is effective for annual periods beginning on or after December 15, 2008. SFAS 160 will change the
accounting and reporting for minority interests, as well as requiring expanded disclosures.
In March 2008, the FASB issued FASB Statement No. 161, Disclosures about Derivative Instruments and
Hedging Activities (“SFAS 161”). SFAS 161 requires enhanced disclosures about how and why companies use
derivatives, how derivative instruments and related hedged items are accounted for and how derivative instruments
and related hedged items affect a company’s financial position, financial performance and cash flows. The
provisions of SFAS 161 are effective for financial statements issued for fiscal years and interim periods beginning
after November 15, 2008. SFAS 161 requires us to expand certain disclosures. We do not anticipate that the adoption
of SFAS 161 will have a significant impact on our consolidated financial position, results of operations or cash
flows.
Reclassifications
Certain reclassifications have been made to the prior year amounts to conform to the current year presentation.
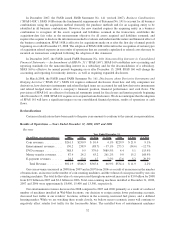
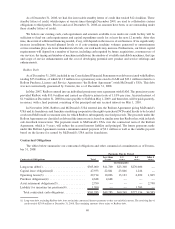
Results of Operations — Years Ended December 31, 2008, 2007 and 2006
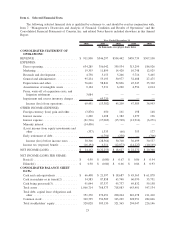
Revenue
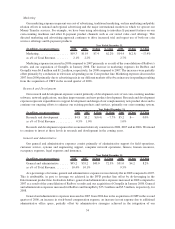
(In millions, except percentages) 2008 2007 $ Chng % Chng 2006 $ Chng % Chng
Year Ended December 31,
Coin revenues............ $261.3 $250.9 $ 10.4 4.1% $229.9 $ 21.0 9.1%
Entertainment revenues ..... 150.2 238.9 (88.7) ⫺37.1% 273.5 (34.6) ⫺12.7%
DVD revenues ........... 388.5 9.5 379.0 3989.5% 4.4 5.1 115.9%
Money transfer revenues .... 87.4 24.2 63.2 261.2% 9.0 15.2 168.9%
E-payment revenues ....... 24.5 22.8 1.7 7.5% 17.6 5.2 29.5%
Total Revenue .......... $911.9 $546.3 $365.6 66.9% $534.4 $ 11.9 2.2%
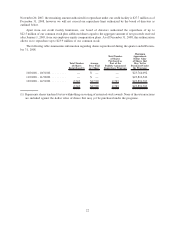
Our coin revenues increased in 2008 from 2007 and in 2007 from 2006 as a result of an increase in the number
of transactions, an increase in the number of coin counting machines, and the volume of coins processed by our coin
counting machines. The total dollar value of coins processed through our network increased to $3.0 billion for 2008
from $2.9 billion in 2007 and $2.6 billion in 2006. Total coin-counting machines installed at December 31, 2008,
2007 and 2006 were approximately 18,400, 15,400 and 13,500, respectively.
Our entertainment revenues decreased in 2008 compared to 2007 and 2006 primarily as a result of a reduced
number of machines installed in Wal-Mart locations, our decision to resign certain lower performing accounts,
decreased foot traffic at our retailers’ locations, softness in the economy, increased fuel prices, and a deflated
housing market. While we are watching these trends closely, we believe macro economic issues will continue to
negatively affect retailer foot traffic for the foreseeable future. The installed base of entertainment machines
32