Redbox 2008 Annual Report Download - page 26
Download and view the complete annual report
Please find page 26 of the 2008 Redbox annual report below. You can navigate through the pages in the report by either clicking on the pages listed below, or by using the keyword search tool below to find specific information within the annual report.-
 1
1 -
2
-
3
-
4
-
5
-
6
-
7
-
8
-
9
-
10
-
11
-
12
-
13
-
14
-
15
-
 16
16 -
 17
17 -
 18
18 -
 19
19 -
 20
20 -
 21
21 -
 22
22 -
 23
23 -
 24
24 -
 25
25 -
 26
26 -
 27
27 -
 28
28 -
 29
29 -
 30
30 -
 31
31 -
 32
32 -
 33
33 -
 34
34 -
 35
35 -
 36
36 -
37
-
38
-
39
-
40
-
41
-
42
-
43
-
44
-
45
-
46
-
47
-
48
-
49
-
50
-
51
-
52
-
53
-
54
-
55
-
56
-
57
-
58
-
59
-
60
-
61
-
62
-
63
-
64
-
65
-
66
-
67
-
68
-
69
-
70
-
71
-
72
-
73
-
74
-
75
-
76
-
77
-
78
-
79
-
80
-
81
-
82
-
83
-
84
-
85
-
86
-
87
-
88
-
89
-
90
-
91
-
92
-
93
-
94
-
95
-
96
-
97
-
98
-
99
-
100
-
101
-
102
-
103
-
104
-
105
-
106
-
107
-
108
-
109
-
110
-
111
-
112
-
113
-
114
-
115
-
116
-
117
-
118
-
119
-
120
-
121
-
122
-
123
-
124
-
125
-
126
-
127
-
128
-
129
-
130
-
131
-
132
 |
 |

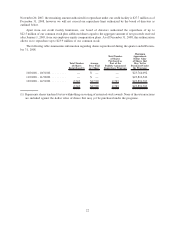
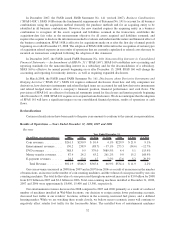
On January 1, 2008, we exercised our option to acquire a majority ownership interest in the voting equity of
Redbox Automated Retail, LLC (“Redbox”) under the terms of the LLC Interest Purchase Agreement dated
November 17, 2005. In conjunction with the option exercise and payment of $5.1 million, our ownership
interest increased from 47.3% to 51.0%. Since our original investment in Redbox, we had been accounting for
our 47.3% ownership interest under the equity method in our Consolidated Financial Statements. Effective
with the close of this transaction, January 18, 2008, we now consolidate Redbox’s financial results into our
Consolidated Financial Statements.
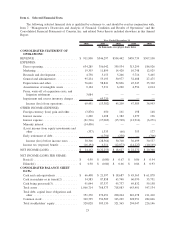
(1) See Note 12 to Consolidated Financial Statements for an explanation of the determination of the number of
shares used in computing net income per share information, basic and diluted.
(2) Cash in machines or in transit is unavailable for immediate cash requirements as it represents cash being
processed by carriers, cash deposits in transit, or cash residing in our coin-counting or entertainment services
machines.
(3) Cash being processed represents cash residing in our coin-counting or entertainment services machines or being
processed by carriers, which we are specifically obligated to use to settle our accrued liabilities payable to
retailers.
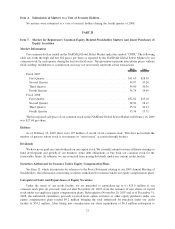
Item 7. Management’s Discussion and Analysis of Financial Condition and Results of Operations.
The following discussion and analysis should be read in conjunction with our Consolidated Financial
Statements and related Notes thereto included elsewhere in this Annual Report. Except for the consolidated
historical information, the following discussion contains forward-looking statements. Actual results could differ
from those projected in the forward-looking statements. Please refer to “Special Note Regarding Forward-Looking
Statements” and “Risk Factors” elsewhere in this Annual Report.
Overview
We are a multi-national company offering a range of 4th Wall», solutions for retailers’ storefronts. The
4th Wall is typically an area between the cash registers and front door of retail locations that in the past has generally
not been managed to optimize revenue per square foot. Our services consist of self-service coin counting, self-
service DVD kiosks where consumers can rent or purchase movies, entertainment services such as skill-crane
machines, bulk vending machines and kiddie rides, money transfer services, and electronic payment (“E-payment”)
services such as stored value cards, payroll cards, prepaid debit cards and prepaid wireless products via point-of-
sale terminals and stored value kiosks. Our products and services can be found at more than 90,000 points of
presence including supermarkets, drug stores, mass merchants, financial institutions, convenience stores, restau-
rants and money transfer agent locations.
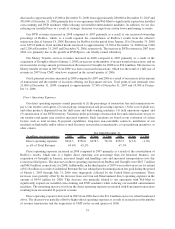
Management of Business Segments
In early 2008, we assessed our business segments due to changes in our business and product lines as well as
our organizational structure. We redefined our business segments from North America and International to Coin and
Entertainment services, DVD services, Money Transfer services and E-payment services. We manage our business
by evaluating the financial results of these segments, focusing primarily on segment revenue and segment operating
income/loss before depreciation and amortization and unallocated expenses (“segment operating income/loss”).
Segment operating income/loss contains the internally allocated costs including the shared service functions, which
consist primarily of field operations, sales, finance, legal, human resources, and information technology.
We utilize segment revenue and segment operating income/loss because we believe they provide useful
information for effectively allocating resources among business segments, evaluating the health of our business
segments based on metrics that management can actively influence, and gauging our investments and our ability to
service, incur or pay down debt. Specifically, our CEO evaluates segment revenue and segment operating income/
loss, and assesses the performance of each business segment based on these measures, as well as, among other
things, the prospects of each of the segments and how they fit into our overall strategy. Our CEO then decides
24