NetSpend 2015 Annual Report Download - page 92
Download and view the complete annual report
Please find page 92 of the 2015 NetSpend annual report below. You can navigate through the pages in the report by either clicking on the pages listed below, or by using the keyword search tool below to find specific information within the annual report.-
 1
1 -
2
-
3
-
4
-
5
-
6
-
7
-
8
-
9
-
10
-
11
-
12
-
13
-
14
-
15
-
16
-
17
-
18
-
19
-
20
-
21
-
22
-
23
-
24
-
25
-
26
-
27
-
28
-
29
-
30
-
31
-
32
-
33
-
34
-
35
-
36
-
37
-
38
-
39
-
40
-
41
-
42
-
43
-
44
-
45
-
46
-
47
-
48
-
49
-
50
-
51
-
52
-
53
-
54
-
55
-
56
-
57
-
58
-
59
-
60
-
61
-
62
-
63
-
64
-
65
-
66
-
67
-
68
-
69
-
70
-
71
-
72
-
73
-
74
-
75
-
76
-
77
-
78
-
79
-
80
-
81
-
 82
82 -
 83
83 -
 84
84 -
 85
85 -
 86
86 -
 87
87 -
 88
88 -
 89
89 -
 90
90 -
 91
91 -
 92
92 -
 93
93 -
 94
94 -
 95
95 -
 96
96 -
 97
97 -
 98
98 -
 99
99 -
 100
100
 |
 |

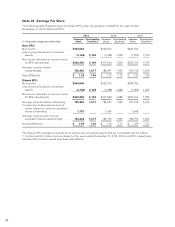
Note 26 Earnings Per Share
The following table illustrates basic and diluted EPS under the guidance of GAAP for the years ended
December 31, 2015, 2014 and 2013:
2015 2014 2013
(in thousands, except per share data)
Common
Stock Participating
Securities Common
Stock Participating
Securities Common
Stock Participating
Securities
Basic EPS:
Net income .......................... $364,044 $322,872 $244,750
Less income allocated to nonvested
awards ............................ (3,164) 3,164 (3,308) 3,308 (1,595) 1,595
Net income allocated to common stock
for EPS calculation(a) ................ $360,880 3,164 $319,564 3,308 $243,155 1,595
Average common shares
outstanding(b) ..................... 182,465 1,617 184,297 1,925 187,145 1,246
Basic EPS(a)/(b) ....................... $ 1.98 1.96 $ 1.73 1.72 $ 1.30 1.28
Diluted EPS:
Net income .......................... $364,044 $322,872 $244,750
Less income allocated to nonvested
awards ............................ (3,148) 3,148 (3,288) 3,288 (1,585) 1,585
Net income allocated to common stock
for EPS calculation(c) ................ $360,896 3,148 $319,584 3,288 $243,165 1,585
Average common shares outstanding .... 182,465 1,617 184,297 1,925 187,145 1,246
Increase due to assumed issuance of
shares related to common equivalent
shares outstanding .................. 1,157 1,459 1,648
Average common and common
equivalent shares outstanding(d) ...... 183,622 1,617 185,756 1,925 188,793 1,246
Diluted EPS(c)/(d) ..................... $ 1.97 1.95 $ 1.72 1.71 $ 1.29 1.27
The diluted EPS calculation excludes stock options and nonvested awards that are convertible into 0.6 million,
1.1 million and 2.9 million common shares for the years ended December 31, 2015, 2014 and 2013, respectively,
because their inclusion would have been anti-dilutive.
88