NetSpend 2015 Annual Report Download - page 72
Download and view the complete annual report
Please find page 72 of the 2015 NetSpend annual report below. You can navigate through the pages in the report by either clicking on the pages listed below, or by using the keyword search tool below to find specific information within the annual report.-
 1
1 -
2
-
3
-
4
-
5
-
6
-
7
-
8
-
9
-
10
-
11
-
12
-
13
-
14
-
15
-
16
-
17
-
18
-
19
-
20
-
21
-
22
-
23
-
24
-
25
-
26
-
27
-
28
-
29
-
30
-
31
-
32
-
33
-
34
-
35
-
36
-
37
-
38
-
39
-
40
-
41
-
42
-
43
-
44
-
45
-
46
-
47
-
48
-
49
-
50
-
51
-
52
-
53
-
54
-
55
-
56
-
57
-
58
-
59
-
60
-
61
-
 62
62 -
 63
63 -
 64
64 -
 65
65 -
 66
66 -
 67
67 -
 68
68 -
 69
69 -
 70
70 -
 71
71 -
 72
72 -
 73
73 -
 74
74 -
 75
75 -
 76
76 -
 77
77 -
 78
78 -
 79
79 -
 80
80 -
 81
81 -
 82
82 -
83
-
84
-
85
-
86
-
87
-
88
-
89
-
90
-
91
-
92
-
93
-
94
-
95
-
96
-
97
-
98
-
99
-
100
 |
 |

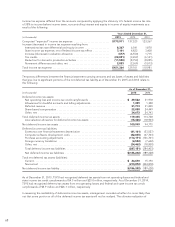
Income tax expense differed from the amounts computed by applying the statutory U.S. federal income tax rate
of 35% to income before income taxes, noncontrolling interest and equity in income of equity investments as a
result of the following:
Years Ended December 31,
(in thousands) 2015 2014 2013
Computed “expected” income tax expense .......................... $173,911 137,525 123,367
Increase (decrease) in income tax expense resulting from:
International tax rate differential and equity income .................. 8,367 6,541 1,870
State income tax expense, net of federal income tax effect ............ 7,101 4,823 3,408
Increase (decrease) in valuation allowance .......................... (517) (4,550) 1,715
Tax credits .................................................... (28,831) (3,459) (6,141)
Deduction for domestic production activities ........................ (11,550) (8,750) (8,225)
Permanent differences and other, net .............................. 2,883 (2,369) (5,013)
Total income tax expense .......................................... $151,364 129,761 110,981
Temporary differences between the financial statement carrying amounts and tax bases of assets and liabilities
that give rise to significant portions of the net deferred tax liability as of December 31, 2015 and 2014 relate to
the following:
As of December 31,
(in thousands) 2015 2014
Deferred income tax assets:
Net operating loss and income tax credit carryforwards ........................... $ 29,522 31,978
Allowances for doubtful accounts and billing adjustments ......................... 1,399 1,328
Deferred revenue .......................................................... 31,713 31,240
Share-based compensation .................................................. 22,088 24,449
Other, net ................................................................ 34,673 24,743
Total deferred income tax assets ............................................... 119,395 113,738
Less valuation allowance for deferred income tax assets .......................... (18,446) (18,963)
Net deferred income tax assets ................................................. 100,949 94,775
Deferred income tax liabilities:
Excess tax over financial statement depreciation ................................ (61,161) (53,527)
Computer software development costs ........................................ (82,835) (67,703)
Purchase accounting adjustments ............................................. (114,171) (136,701)
Foreign currency translation ................................................. (4,522) (7,642)
Other, net ................................................................ (24,462) (18,830)
Total deferred income tax liabilities ........................................... (287,151) (284,403)
Net deferred income tax liabilities ............................................ $(186,202) (189,628)
Total net deferred tax assets (liabilities):
Current ................................................................... $ 24,670 15,190
Noncurrent ............................................................... (210,872) (204,818)
Net deferred income tax liability ................................................ $(186,202) (189,628)
As of December 31, 2015, TSYS had recognized deferred tax assets from net operating losses and federal and
state income tax credit carryforwards of $4.5 million and $25.0 million, respectively. As of December 31, 2014,
TSYS had recognized deferred tax assets from net operating losses and federal and state income tax credit
carryforwards of $5.9 million and $26.1 million, respectively
In assessing the realizability of deferred income tax assets, management considers whether it is more likely than
not that some portion or all of the deferred income tax assets will not be realized. The ultimate realization of
68