NetSpend 2015 Annual Report Download - page 30
Download and view the complete annual report
Please find page 30 of the 2015 NetSpend annual report below. You can navigate through the pages in the report by either clicking on the pages listed below, or by using the keyword search tool below to find specific information within the annual report.-
 1
1 -
2
-
3
-
4
-
5
-
6
-
7
-
8
-
9
-
10
-
11
-
12
-
13
-
14
-
15
-
16
-
17
-
18
-
19
-
 20
20 -
 21
21 -
 22
22 -
 23
23 -
 24
24 -
 25
25 -
 26
26 -
 27
27 -
 28
28 -
 29
29 -
 30
30 -
 31
31 -
 32
32 -
 33
33 -
 34
34 -
 35
35 -
 36
36 -
 37
37 -
 38
38 -
 39
39 -
 40
40 -
41
-
42
-
43
-
44
-
45
-
46
-
47
-
48
-
49
-
50
-
51
-
52
-
53
-
54
-
55
-
56
-
57
-
58
-
59
-
60
-
61
-
62
-
63
-
64
-
65
-
66
-
67
-
68
-
69
-
70
-
71
-
72
-
73
-
74
-
75
-
76
-
77
-
78
-
79
-
80
-
81
-
82
-
83
-
84
-
85
-
86
-
87
-
88
-
89
-
90
-
91
-
92
-
93
-
94
-
95
-
96
-
97
-
98
-
99
-
100
 |
 |

The products within this segment provide underbanked consumers with access to FDIC-insured depository
accounts with a menu of pricing and features specifically tailored to their needs. This segment has an extensive
distribution and reload network comprised of financial service centers, employers and retail locations throughout
the United States. The NetSpend segment markets prepaid cards through multiple distribution channels,
including alternative financial service providers, traditional retailers, direct-to-consumer and online marketing
programs and contractual relationships with corporate employers.
The NetSpend segment’s revenues primarily consist of a portion of the service fees and interchange revenues
received by NetSpend’s prepaid card Issuing Banks in connection with the programs managed by this segment.
Cardholders are charged fees for transactions including fees for PIN and signature-based purchase transactions
made using their prepaid cards, for ATM withdrawals or other transactions conducted at ATMs, for balance
inquiries, and monthly maintenance fees among others. Cardholders are also charged fees associated with
additional products and services offered in connection with certain cards including the use of overdraft features,
bill payment options, custom card designs and card-to-card transfers of funds initiated through call centers. The
NetSpend segment also earns revenues from a portion of the interchange fees remitted by merchants when
cardholders make purchase transactions using their cards. Subject to applicable law, interchange fees are fixed
by card associations and network organizations.
This segment has no major customers.
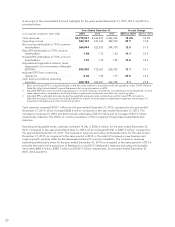
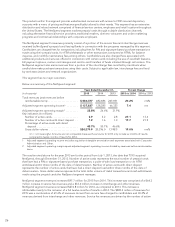
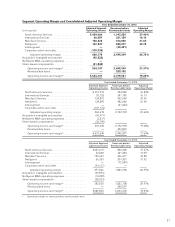
Below is a summary of the NetSpend segment:
Years Ended December 31, Percent Change
(in thousands) 2015 2014 2013 2015 vs. 2014 2014 vs. 2013
Total revenues (and revenues before
reimbursable items) ...................... $ 580,377 482,686 207,851 20.2% nm%
Adjusted segment operating income1........ $ 137,837 128,285 66,353 7.4 nm
Adjusted segment operating margin2......... 23.8% 26.6% 31.9%
Key indicators (in millions):
Number of active cards ................... 3.9 3.2 2.8 29.1 13.4
Number of active cards with direct deposit . . 1.9 1.6 1.3 17.7 21.9
Percentage of active cards with direct
deposit .............................. 48.7% 50.1% 46.6%
Gross dollar volume ..................... $24,274.9 20,296.0 7,748.5 19.6% nm%
nm = not meaningful. Amounts are not comparable because the amounts for 2013 only include six months of results
compared to twelve months of results for 2014.
1 Adjusted segment operating income excludes acquisition intangible amortization and expenses associated with Corporate
Administration and Other.
2 Adjusted segment operating margin equals adjusted segment operating income divided by revenues before reimbursable
items.
The results noted above for the year 2013 are for the period from July 1, 2013, the date that TSYS acquired
NetSpend, through December 31, 2013. Number of active cards represents the total number of prepaid cards
that have had a PIN or signature-based purchase transaction, a point-of-sale load transaction or an ATM
withdrawal within three months of the date of determination. Number of active cards with direct deposit
represents the number of active cards that have had a direct deposit load within three months of the date of
determination. Gross dollar volume represents the total dollar volume of debit transactions and cash withdrawals
made using the prepaid cards the NetSpend segment manages.
NetSpend segment revenues increased $97.7 million for 2015 from 2014. This increase was comprised of a $64.3
million increase in service fee revenues and a $33.4 million increase in interchange and other revenues.
NetSpend segment revenues increased $274.8 million for 2014, as compared to 2013. This increase is
attributable mainly to the inclusion of a full twelve months of results in 2014. The $580.4 million of revenues for
2015 was a combination of 69.6% of revenues derived from service fees charged to cardholders and 30.4% of
revenues derived from interchange and other revenues. Service fee revenues are driven by the number of active
26