NetSpend 2015 Annual Report Download - page 4
Download and view the complete annual report
Please find page 4 of the 2015 NetSpend annual report below. You can navigate through the pages in the report by either clicking on the pages listed below, or by using the keyword search tool below to find specific information within the annual report.-
 1
1 -
 2
2 -
 3
3 -
 4
4 -
 5
5 -
 6
6 -
 7
7 -
 8
8 -
 9
9 -
 10
10 -
 11
11 -
 12
12 -
 13
13 -
 14
14 -
 15
15 -
16
-
17
-
18
-
19
-
20
-
21
-
22
-
23
-
24
-
25
-
26
-
27
-
28
-
29
-
30
-
31
-
32
-
33
-
34
-
35
-
36
-
37
-
38
-
39
-
40
-
41
-
42
-
43
-
44
-
45
-
46
-
47
-
48
-
49
-
50
-
51
-
52
-
53
-
54
-
55
-
56
-
57
-
58
-
59
-
60
-
61
-
62
-
63
-
64
-
65
-
66
-
67
-
68
-
69
-
70
-
71
-
72
-
73
-
74
-
75
-
76
-
77
-
78
-
79
-
80
-
81
-
82
-
83
-
84
-
85
-
86
-
87
-
88
-
89
-
90
-
91
-
92
-
93
-
94
-
95
-
96
-
97
-
98
-
99
-
100
 |
 |

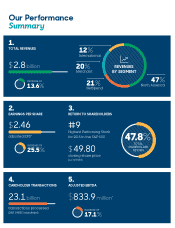
$2.8billion
INCREASE OF
13.6%
47%
North America
12%
International
20%
Merchant
21%
NetSpend
REVENUES
BY SEGMENT
1.
TOTAL REVENUES
$2.46
adjusted EPS*
INCREASE OF
25.5%
2.
EARNINGS PER SHARE
#9
Highest Performing Stock
for 2015 in the S&P 500
$49.80
closing share price
(as of 12/31/2015)
3.
RETURN TO SHAREHOLDERS
23.1billion
transactions processed
per year (excluding NetSpend)
4.
CARDHOLDER TRANSACTIONS
$833.9million*
5.
ADJUSTED EBITDA
INCREASE OF
17.1%
47.8%
TOTAL
SHAREHOLDER
RETURN
Our Performance
Summary