NetSpend 2015 Annual Report Download - page 27
Download and view the complete annual report
Please find page 27 of the 2015 NetSpend annual report below. You can navigate through the pages in the report by either clicking on the pages listed below, or by using the keyword search tool below to find specific information within the annual report.-
 1
1 -
2
-
3
-
4
-
5
-
6
-
7
-
8
-
9
-
10
-
11
-
12
-
13
-
14
-
15
-
16
-
 17
17 -
 18
18 -
 19
19 -
 20
20 -
 21
21 -
 22
22 -
 23
23 -
 24
24 -
 25
25 -
 26
26 -
 27
27 -
 28
28 -
 29
29 -
 30
30 -
 31
31 -
 32
32 -
 33
33 -
 34
34 -
 35
35 -
 36
36 -
 37
37 -
38
-
39
-
40
-
41
-
42
-
43
-
44
-
45
-
46
-
47
-
48
-
49
-
50
-
51
-
52
-
53
-
54
-
55
-
56
-
57
-
58
-
59
-
60
-
61
-
62
-
63
-
64
-
65
-
66
-
67
-
68
-
69
-
70
-
71
-
72
-
73
-
74
-
75
-
76
-
77
-
78
-
79
-
80
-
81
-
82
-
83
-
84
-
85
-
86
-
87
-
88
-
89
-
90
-
91
-
92
-
93
-
94
-
95
-
96
-
97
-
98
-
99
-
100
 |
 |

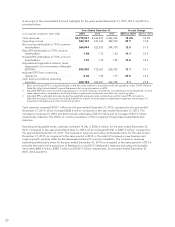
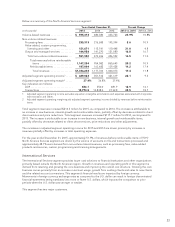
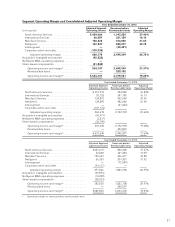
Below is a summary of the North America Services segment:
Years Ended December 31, Percent Change
(in thousands) 2015 2014 2013 2015 vs. 2014 2014 vs. 2013
Volume-based revenues ................ $ 595,314 480,386 433,723 23.9% 10.8%
Non-volume related revenues:
Processing fees ..................... 235,313 216,685 195,394 8.6 10.9
Value-added, custom programming,
licensing and other ................ 151,671 115,741 110,448 31.0 4.8
Output and managed services ......... 164,956 141,270 121,080 16.8 16.7
Total non-volume related revenues . . . 551,940 473,696 426,922 16.5 11.0
Total revenues before reimbursable
items ........................ 1,147,254 954,082 860,645 20.2 10.9
Reimbursable items .............. 187,004 163,682 139,428 14.2 17.4
Total revenues ................ $1,334,258 1,117,764 1,000,073 19.4 11.8
Adjusted segment operating income1..... $ 429,064 351,512 321,619 22.1 9.3
Adjusted segment operating margin2..... 37.4% 36.8% 37.4%
Key indicators (in millions):
AOF............................... 654.1 550.0 481.9 18.9 14.1
Transactions ........................ 15,774.5 10,838.0 9,132.8 45.5 18.7
1 Adjusted segment operating income excludes acquisition intangible amortization and expenses associated with Corporate
Administration and Other.
2 Adjusted segment operating margin equals adjusted segment operating income divided by revenues before reimbursable
items.
Total segment revenues increased $216.5 million for 2015, as compared to 2014. The increase is attributable to
an increase in new business, internal growth and reimbursable items, partially offset by decreases related to client
deconversions and price reductions. Total segment revenues increased $117.7 million for 2014, as compared to
2013. The increase is attributable to an increase in new business, internal growth and reimbursable items,
partially offset by decreases related to client deconversions, price reductions and other adjustments.
The increases in adjusted segment operating income for 2015 and 2014 are driven primarily by increases in
revenues partially offset by increases in total operating expenses.
For the year ended December 31, 2015, approximately 51.9% of revenues before reimbursable items of TSYS’
North America Services segment are driven by the volume of accounts on file and transactions processed and
approximately 48.1% were derived from non-volume based revenues, such as processing fees, value-added
products and services, custom programming and licensing arrangements.
International Services
The International Services segment provides issuer card solutions to financial institutions and other organizations
primarily based outside the North American region. Growth in revenues and operating profit in this segment is
derived from retaining and growing the core business and improving the overall cost structure. Growing the core
business comes primarily from an increase in account usage, growth from existing clients and sales to new clients
and the related account conversions. This segment’s financial results are impacted by foreign currency.
Movements in foreign currency exchange rates as compared to the U.S. dollar can result in foreign denominated
financial statements being translated into more or fewer U.S. dollars, which impacts the comparison to prior
periods when the U.S. dollar was stronger or weaker.
This segment has two major customers.
23