NetSpend 2015 Annual Report Download - page 64
Download and view the complete annual report
Please find page 64 of the 2015 NetSpend annual report below. You can navigate through the pages in the report by either clicking on the pages listed below, or by using the keyword search tool below to find specific information within the annual report.-
 1
1 -
2
-
3
-
4
-
5
-
6
-
7
-
8
-
9
-
10
-
11
-
12
-
13
-
14
-
15
-
16
-
17
-
18
-
19
-
20
-
21
-
22
-
23
-
24
-
25
-
26
-
27
-
28
-
29
-
30
-
31
-
32
-
33
-
34
-
35
-
36
-
37
-
38
-
39
-
40
-
41
-
42
-
43
-
44
-
45
-
46
-
47
-
48
-
49
-
50
-
51
-
52
-
53
-
 54
54 -
 55
55 -
 56
56 -
 57
57 -
 58
58 -
 59
59 -
 60
60 -
 61
61 -
 62
62 -
 63
63 -
 64
64 -
 65
65 -
 66
66 -
 67
67 -
 68
68 -
 69
69 -
 70
70 -
 71
71 -
 72
72 -
 73
73 -
 74
74 -
75
-
76
-
77
-
78
-
79
-
80
-
81
-
82
-
83
-
84
-
85
-
86
-
87
-
88
-
89
-
90
-
91
-
92
-
93
-
94
-
95
-
96
-
97
-
98
-
99
-
100
 |
 |

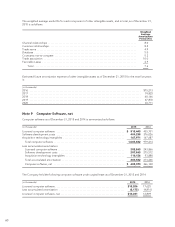
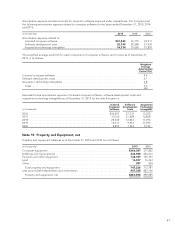
The weighted average useful life for each component of other intangible assets, and in total, as of December 31,
2015 is as follows:
Weighted
Average
Amortization
Period (Yrs)
Channel relationships ................................................................. 8.0
Customer relationships ................................................................ 8.2
Trade name ......................................................................... 4.9
Database ........................................................................... 5.0
Covenants-not-to-compete ............................................................ 5.3
Trade association .................................................................... 10.0
Favorable Lease ..................................................................... 4.9
Total ........................................................................... 7.6
Estimated future amortization expense of other intangible assets as of December 31, 2015 for the next five years
is:
(in thousands)
2016 .................................................................................. $75,213
2017 .................................................................................. 74,823
2018 .................................................................................. 60,166
2019 .................................................................................. 47,870
2020 .................................................................................. 43,711
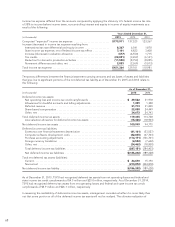
Note 9 Computer Software, net
Computer software as of December 31, 2015 and 2014 is summarized as follows:
(in thousands) 2015 2014
Licensed computer software .................................................. $ 513,443 435,701
Software development costs .................................................. 404,238 376,026
Acquisition technology intangibles ............................................. 167,971 167,687
Total computer software .................................................... 1,085,652 979,414
Less accumulated amortization:
Licensed computer software ................................................. 282,563 243,866
Software development costs ................................................ 287,863 275,512
Acquisition technology intangibles ........................................... 110,156 93,888
Total accumulated amortization .............................................. 680,582 613,266
Computer software, net .................................................... $ 405,070 366,148
The Company held the following computer software under capital lease as of December 31, 2015 and 2014:
(in thousands) 2015 2014
Licensed computer software ................................................... $18,206 17,625
Less accumulated amortization ................................................ (8,175) (4,816)
Licensed computer software, net ............................................... $10,031 12,809
60