NetSpend 2015 Annual Report Download - page 37
Download and view the complete annual report
Please find page 37 of the 2015 NetSpend annual report below. You can navigate through the pages in the report by either clicking on the pages listed below, or by using the keyword search tool below to find specific information within the annual report.-
 1
1 -
2
-
3
-
4
-
5
-
6
-
7
-
8
-
9
-
10
-
11
-
12
-
13
-
14
-
15
-
16
-
17
-
18
-
19
-
20
-
21
-
22
-
23
-
24
-
25
-
26
-
 27
27 -
 28
28 -
 29
29 -
 30
30 -
 31
31 -
 32
32 -
 33
33 -
 34
34 -
 35
35 -
 36
36 -
 37
37 -
 38
38 -
 39
39 -
 40
40 -
 41
41 -
 42
42 -
 43
43 -
 44
44 -
 45
45 -
 46
46 -
 47
47 -
48
-
49
-
50
-
51
-
52
-
53
-
54
-
55
-
56
-
57
-
58
-
59
-
60
-
61
-
62
-
63
-
64
-
65
-
66
-
67
-
68
-
69
-
70
-
71
-
72
-
73
-
74
-
75
-
76
-
77
-
78
-
79
-
80
-
81
-
82
-
83
-
84
-
85
-
86
-
87
-
88
-
89
-
90
-
91
-
92
-
93
-
94
-
95
-
96
-
97
-
98
-
99
-
100
 |
 |

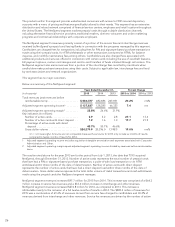
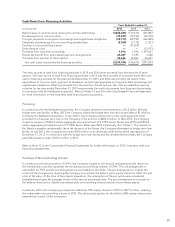
Cash Flows from Operating Activities
Years Ended December 31,
(in thousands) 2015 2014 2013
Net income ......................................................... $369,041 329,406 256,597
Depreciation and amortization ......................................... 258,264 248,018 205,351
Other noncash items and charges, net ................................... 50,458 (27,928) 76,744
Net change in current and other assets and current and other liabilities ....... (77,569) 10,705 (86,294)
Net cash provided by operating activities .............................. $600,194 560,201 452,398
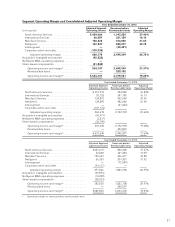
TSYS’ main source of funds is derived from operating activities, specifically net income. The increases in 2015 and
2014, as compared to the previous years, in net cash provided by operating activities were primarily the result of
increased earnings.
Net change in current and other assets and current and other liabilities include accounts receivable, prepaid
expenses, other current assets and other assets, accounts payable, accrued salaries and employee benefits and
other liabilities. The change in accounts receivable between the years is the result of timing of collections
compared to billings. The change in accounts payable and other liabilities between years is the result of the
timing of payments and the reduction of liabilities related to the disposal of the Company’s Japan operations.
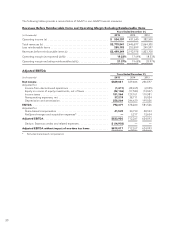
Cash Flows from Investing Activities
Years Ended December 31,
(in thousands) 2015 2014 2013
Additions to contract acquisition costs ................................ $ (58,728) (88,871) (55,965)
Purchases of property and equipment, net ............................ (54,640) (75,913) (40,598)
Additions to licensed computer software from vendors .................. (50,729) (29,638) (63,635)
Additions to internally developed computer software ................... (39,219) (41,501) (33,600)
Purchases of private equity investments ............................... (3,525) (3,291) (1,378)
Cash used in acquisitions, net of cash acquired ........................ (750) (38,584) (1,314,660)
Proceeds from insurance recovery for loss on disposal ................... —6,212 —
Proceeds from sale of private equity investment ........................ 1,839 ——
Proceeds from dispositions, net of expenses paid and cash disposed ...... 3,568 44,979 —
Net cash used in investing activities ................................ $(202,184) (226,607) (1,509,836)
The major uses of cash for investing activities in 2015, 2014 and 2013 were for additions to contract acquisition
costs, equipment, acquisitions, internally developed computer software and licensed computer software from
vendors.
Contract Acquisition Costs
TSYS makes cash payments for processing rights, third-party development costs and other direct salary-related
costs in connection with converting new customers to the Company’s processing systems. The Company’s
investments in contract acquisition costs were $58.7 million in 2015, $88.9 million in 2014 and $56.0 million in
2013. The Company made cash payments for processing rights of $29.6 million, $21.7 million and $9.7 million in
2015, 2014 and 2013, respectively. Conversion cost additions were $29.1 million, $67.2 million and $46.3 million
in 2015, 2014 and 2013, respectively. The decreases in conversion costs in 2015 compared to 2014, and the
increase in 2014 compared to 2013, are primarily related to the conversion of Bank of America’s consumer card
portfolio.
Property and Equipment
Capital expenditures for property and equipment were $54.6 million in 2015, compared to $75.9 million in 2014
and $40.6 million in 2013. The majority of capital expenditures in 2015 and 2014 related to computer processing
33