NetSpend 2015 Annual Report Download - page 24
Download and view the complete annual report
Please find page 24 of the 2015 NetSpend annual report below. You can navigate through the pages in the report by either clicking on the pages listed below, or by using the keyword search tool below to find specific information within the annual report.-
 1
1 -
2
-
3
-
4
-
5
-
6
-
7
-
8
-
9
-
10
-
11
-
12
-
13
-
 14
14 -
 15
15 -
 16
16 -
 17
17 -
 18
18 -
 19
19 -
 20
20 -
 21
21 -
 22
22 -
 23
23 -
 24
24 -
 25
25 -
 26
26 -
 27
27 -
 28
28 -
 29
29 -
 30
30 -
 31
31 -
 32
32 -
 33
33 -
 34
34 -
35
-
36
-
37
-
38
-
39
-
40
-
41
-
42
-
43
-
44
-
45
-
46
-
47
-
48
-
49
-
50
-
51
-
52
-
53
-
54
-
55
-
56
-
57
-
58
-
59
-
60
-
61
-
62
-
63
-
64
-
65
-
66
-
67
-
68
-
69
-
70
-
71
-
72
-
73
-
74
-
75
-
76
-
77
-
78
-
79
-
80
-
81
-
82
-
83
-
84
-
85
-
86
-
87
-
88
-
89
-
90
-
91
-
92
-
93
-
94
-
95
-
96
-
97
-
98
-
99
-
100
 |
 |

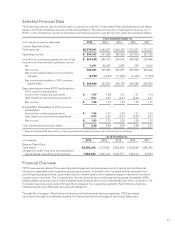
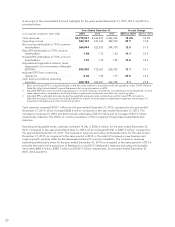
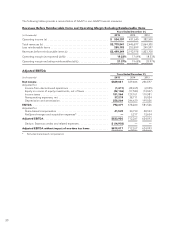
A summary of the consolidated financial highlights for the years ended December 31, 2015, 2014, and 2013 is
provided below:
Years Ended December 31, Percent Change
(in thousands, except per share data) 2015 2014 2013 2015 vs. 2014 2014 vs. 2013
Total revenues ........................ $2,779,541 2,446,877 2,064,305 13.6% 18.5%
Operating income ..................... 534,107 431,640 382,500 23.7 12.8
Net income attributable to TSYS common
shareholders ........................ 364,044 322,872 244,750 12.8 31.9
Basic EPS attributable to TSYS common
shareholders1....................... 1.98 1.73 1.30 14.1 33.5
Diluted EPS attributable to TSYS common
shareholders1....................... 1.97 1.72 1.29 14.2 33.6
Adjusted earnings before interest, taxes,
depreciation and amortization (Adjusted
EBITDA)2........................... 833,920 712,267 624,093 17.1 14.1
Adjusted EPS3from continuing
operations ......................... 2.46 1.96 1.73 25.5 13.2
Cash flows provided by operating
activities ........................... 600,194 560,201 452,398 7.1 23.8
1 Basic and diluted EPS is computed based on the two-class method in accordance with the guidance under GAAP. Refer to
Note 26 in the Consolidated Financial Statements for more information on EPS.
2 Adjusted EBITDA is net income excluding equity in income of equity investments, nonoperating income/(expense), income
taxes, depreciation, amortization and stock-based compensation expenses and other non-recurring items.
3 Adjusted EPS is adjusted earnings divided by weighted average shares outstanding used for basic EPS calculations.
Adjusted earnings is net income excluding theafter-tax impact of stock-based compensation expenses, amortization of
acquisition intangibles and other nonrecurring items.
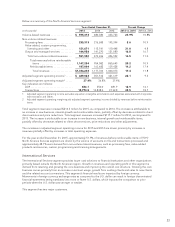
Total revenues increased $332.7 million for the year ended December 31, 2015, compared to the year ended
December 31, 2014, which increased $382.6 million compared to the year ended December 31, 2013. The
increases in revenues for 2015 and 2014 include a decrease of $31.5 million and an increase of $14.9 million,
respectively, related to the effects of currency translation of the Company’s foreign-based subsidiaries and
branches.
Excluding reimbursable items, revenues increased 14.0%, or $306.4 million, for the year ended December 31,
2015, compared to the year ended December 31, 2014, which increased 20.2%, or $369.3 million, compared to
the year ended December 31, 2013. The increase in revenues excluding reimbursable items for the year ended
December 31, 2015, as compared to the same period in 2014, is the result of increases in new business and
organic growth, partially offset by decreases associated with currency translation. The increase in revenues
excluding reimbursable items for the year ended December 31, 2014 as compared to the same period in 2013 is
primarily the result of the acquisition of NetSpend in July 2013. NetSpend’s revenues excluding reimbursable
items were $580.4 million, $482.7 million and $207.9 million, respectively, for the years ended December 31,
2015, 2014 and 2013.
20