NetSpend 2015 Annual Report Download - page 82
Download and view the complete annual report
Please find page 82 of the 2015 NetSpend annual report below. You can navigate through the pages in the report by either clicking on the pages listed below, or by using the keyword search tool below to find specific information within the annual report.-
 1
1 -
2
-
3
-
4
-
5
-
6
-
7
-
8
-
9
-
10
-
11
-
12
-
13
-
14
-
15
-
16
-
17
-
18
-
19
-
20
-
21
-
22
-
23
-
24
-
25
-
26
-
27
-
28
-
29
-
30
-
31
-
32
-
33
-
34
-
35
-
36
-
37
-
38
-
39
-
40
-
41
-
42
-
43
-
44
-
45
-
46
-
47
-
48
-
49
-
50
-
51
-
52
-
53
-
54
-
55
-
56
-
57
-
58
-
59
-
60
-
61
-
62
-
63
-
64
-
65
-
66
-
67
-
68
-
69
-
70
-
71
-
 72
72 -
 73
73 -
 74
74 -
 75
75 -
 76
76 -
 77
77 -
 78
78 -
 79
79 -
 80
80 -
 81
81 -
 82
82 -
 83
83 -
 84
84 -
 85
85 -
 86
86 -
 87
87 -
 88
88 -
 89
89 -
 90
90 -
 91
91 -
 92
92 -
93
-
94
-
95
-
96
-
97
-
98
-
99
-
100
 |
 |

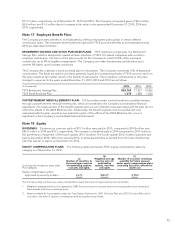
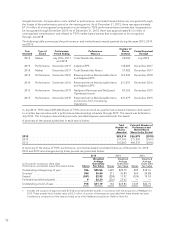
As of December 31, 2015 the average remaining contractual life and intrinsic value of TSYS’ outstanding and
exercisable stock options were as follows:
Outstanding Exercisable
Average remaining contractual life (in years) ................................... 7.8 7.2
Aggregate intrinsic value (in thousands) ....................................... $62,738 35,434
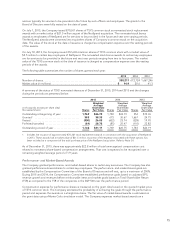
Shares Issued for Options Exercised
During 2015, 2014 and 2013, employees of the Company exercised options for shares of TSYS common stock
that were issued from treasury. The table below summarizes these stock option exercises by year:
(in thousands) Options Exercised and
Issued from Treasury Intrinsic Value
2015 .......................................................... 2,586 $67,702
2014 .......................................................... 1,850 22,883
2013 .......................................................... 2,177 16,580
For awards granted before January 1, 2006 that were not fully vested on January 1, 2006, the Company will
record the tax benefits from the exercise of stock options as increases to the “Additional paid-in capital” line item
of the Consolidated Balance Sheets. If the Company does recognize tax benefits, the Company will record these
tax benefits from share-based compensation costs as cash inflows in the financing section and cash outflows in
the operating section in the Statement of Cash Flows. The Company has elected to use the short-cut method to
calculate its historical pool of windfall tax benefits.
As of December 31, 2015, there was approximately $2.9 million of total unrecognized compensation cost related
to TSYS stock options that is expected to be recognized over a remaining weighted average period of 1.5 years.
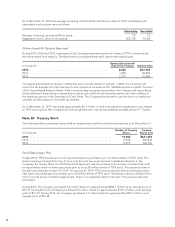
Note 20 Treasury Stock
The following table summarizes shares held as treasury stock and their related carrying value as of December 31:
(in thousands) Number of Treasury
Shares Treasury
Shares Cost
2015 ............................................................. 19,988 $641,664
2014 .............................................................. 17,836 453,230
2013 .............................................................. 15,073 326,996
Stock Repurchase Plan
In April 2010, TSYS announced a stock repurchase plan to purchase up to 10 million shares of TSYS stock. The
shares may be purchased from time to time over the next two years at prices considered attractive to the
Company. By January 2014, the TSYS Board had approved several increases in the number of shares that could
be repurchased under its share repurchase plan to up to 28 million shares of TSYS stock. The expiration date of
the plan was extended to April 30, 2015. On January 27, 2015, TSYS announced that its Board had approved a
new stock repurchase plan to purchase up to 20 million shares of TSYS stock. The shares may be purchased from
time to time at prices considered appropriate. There is no expiration date for the plan. The previous plan was
terminated.
During 2015, the Company purchased 5.2 million shares for approximately $242.1 million, at an average price of
$47.01. During 2014, the Company purchased 5.2 million shares for approximately $165.3 million, at an average
price of $31.79. During 2013, the Company purchased 3.1 million shares for approximately $97.6 million, at an
average price of $31.48.
78