NetSpend 2015 Annual Report Download - page 31
Download and view the complete annual report
Please find page 31 of the 2015 NetSpend annual report below. You can navigate through the pages in the report by either clicking on the pages listed below, or by using the keyword search tool below to find specific information within the annual report.-
 1
1 -
2
-
3
-
4
-
5
-
6
-
7
-
8
-
9
-
10
-
11
-
12
-
13
-
14
-
15
-
16
-
17
-
18
-
19
-
20
-
 21
21 -
 22
22 -
 23
23 -
 24
24 -
 25
25 -
 26
26 -
 27
27 -
 28
28 -
 29
29 -
 30
30 -
 31
31 -
 32
32 -
 33
33 -
 34
34 -
 35
35 -
 36
36 -
 37
37 -
 38
38 -
 39
39 -
 40
40 -
 41
41 -
42
-
43
-
44
-
45
-
46
-
47
-
48
-
49
-
50
-
51
-
52
-
53
-
54
-
55
-
56
-
57
-
58
-
59
-
60
-
61
-
62
-
63
-
64
-
65
-
66
-
67
-
68
-
69
-
70
-
71
-
72
-
73
-
74
-
75
-
76
-
77
-
78
-
79
-
80
-
81
-
82
-
83
-
84
-
85
-
86
-
87
-
88
-
89
-
90
-
91
-
92
-
93
-
94
-
95
-
96
-
97
-
98
-
99
-
100
 |
 |

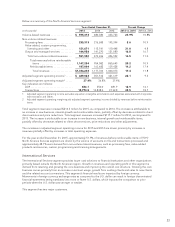
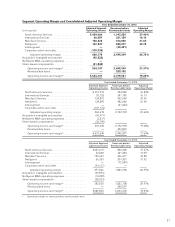
cards and in particular by the number of cards with direct deposit. Cardholders with direct deposit generally
initiate more transactions and generate more revenues than those that do not take advantage of this feature.
Interchange revenues are driven by gross dollar volume. Substantially all of the NetSpend segment revenues are
volume driven as they are driven by the active card and gross dollar volume indicators.
Cardholder funds and deposits related to NetSpend’s prepaid products are held at FDIC-insured Issuing Banks
for the benefit of the cardholders. NetSpend currently has active agreements with six Issuing Banks.
NetSpend’s prepaid card business derived approximately one-fourth of its revenues from cardholders acquired
through one of its third-party distributors.
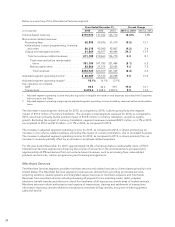
Operating Expenses
The Company’s operating expenses consist of cost of services and selling, general and administrative expenses.
Cost of services describes the direct expenses incurred in performing a particular service for customers, including
the cost of direct labor expense in putting the service in saleable condition. Selling, general and administrative
expenses are incurred in selling or marketing and for the direction of the enterprise as a whole, including
accounting, legal fees, officers’ salaries, investor relations and mergers and acquisitions.
Operating expenses were $2.2 million, $2.0 million and $1.7 million in 2015, 2014 and 2013, respectively. The
changes in operating expenses for the years ended December 31, 2015 and 2014 include a decrease of $30.4
million and an increase of $5.9 million, respectively, related to the effects of currency translation of the
Company’s foreign-based subsidiaries. The changes in operating expenses for the years ended December 31,
2015, 2014 and 2013 were also impacted by the NetSpend acquisition in 2013. NetSpend’s operating expenses
were $535.2 million, $443.5 million and $191.0 million in 2015, 2014 and 2013, respectively. Expenses in 2015
were also impacted by certain one-time state tax benefits of $15.6 million that resulted from prior years but were
recognized in 2015. Expenses in 2014 were also impacted by a significant nonrecurring charitable contribution.
Federal legislation was enacted which makes extensive changes to the current system of health care insurance
and benefits. The Company has reviewed the legislation and, based upon information available, estimates the
impact of the legislation was approximately $2.0 million on 2015, $1.8 million on 2014 and $1.1 million on 2013.
The Company’s merger and acquisition expenses were $64,000, $3.2 million and $14.2 million for the years
ended December 31, 2015, 2014 and 2013, respectively. These expenses consist of legal, accounting and
professional fees, as well as, personnel costs for severance and retention.
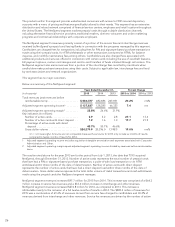
Nonoperating Income (Expense)
Nonoperating income (expense) consists of interest income, interest expense, gains and losses on currency
transactions and gains and losses on investments in private equity. Nonoperating income (expense) decreased in
2015 as compared to 2014, and increased in 2014 as compared to 2013.
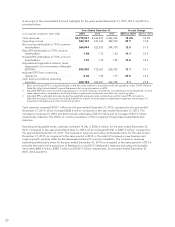
The following table provides a summary of nonoperating expense:
Years Ended December 31, Percent Change
(in thousands) 2015 2014 2013 2015 vs. 2014 2014 vs. 2013
Interest income ............................ $ 1,450 $ 1,109 $ 1,494 30.8% (25.8)%
Interest expense* .......................... (40,701) (40,975) (32,449) (0.7) 26.3
Currency transaction gains(losses), net ......... (388) 142 (1,013) nm nm
Net gains on investments in private equity ..... 3,324 308 338 nm (8.8)
Other .................................... (904) 705 1,606 nm (56.1)
Total ................................... $(37,219) (38,711) (30,024) (3.9) 28.9
* Interest expense includes interest on bonds of $33.7 million, $33.7 million, and $20.5 million, respectively, for the years
ended December 31, 2015, 2014 and 2013.
27