NetSpend 2015 Annual Report Download - page 85
Download and view the complete annual report
Please find page 85 of the 2015 NetSpend annual report below. You can navigate through the pages in the report by either clicking on the pages listed below, or by using the keyword search tool below to find specific information within the annual report.-
 1
1 -
2
-
3
-
4
-
5
-
6
-
7
-
8
-
9
-
10
-
11
-
12
-
13
-
14
-
15
-
16
-
17
-
18
-
19
-
20
-
21
-
22
-
23
-
24
-
25
-
26
-
27
-
28
-
29
-
30
-
31
-
32
-
33
-
34
-
35
-
36
-
37
-
38
-
39
-
40
-
41
-
42
-
43
-
44
-
45
-
46
-
47
-
48
-
49
-
50
-
51
-
52
-
53
-
54
-
55
-
56
-
57
-
58
-
59
-
60
-
61
-
62
-
63
-
64
-
65
-
66
-
67
-
68
-
69
-
70
-
71
-
72
-
73
-
74
-
 75
75 -
 76
76 -
 77
77 -
 78
78 -
 79
79 -
 80
80 -
 81
81 -
 82
82 -
 83
83 -
 84
84 -
 85
85 -
 86
86 -
 87
87 -
 88
88 -
 89
89 -
 90
90 -
 91
91 -
 92
92 -
 93
93 -
 94
94 -
 95
95 -
96
-
97
-
98
-
99
-
100
 |
 |

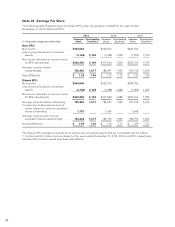
Years Ended December 31,
(in thousands)
Operating Segments 2015 2014 2013
Revenues before reimbursable items
North America Services ....................................... $ 1,147,254 954,082 860,645
International Services ......................................... 331,159 341,785 321,484
Merchant Services ............................................ 474,040 435,649 446,277
NetSpend ................................................... 580,377 482,686 207,851
Intersegment revenues ........................................ (33,481) (21,224) (12,549)
Revenues before reimbursable items from external customers ...... $ 2,499,349 2,192,978 1,823,708
Total revenues
North America Services ....................................... $ 1,334,258 1,117,764 1,000,073
International Services ......................................... 354,725 363,359 341,549
Merchant Services ............................................ 549,369 510,120 533,050
NetSpend ................................................... 580,377 482,686 207,851
Intersegment revenues ........................................ (39,188) (27,052) (18,218)
Revenues from external customers ............................ $ 2,779,541 2,446,877 2,064,305
Depreciation and amortization
North America Services ....................................... $ 99,544 86,513 74,480
International Services ......................................... 34,892 38,909 41,708
Merchant Services ............................................ 18,268 14,571 12,034
NetSpend ................................................... 10,686 7,509 3,121
Segment depreciation and amortization .......................... 163,390 147,502 131,343
Acquisition intangible amortization .............................. 92,522 96,971 65,893
Corporate Administration and Other ............................. 2,352 2,147 1,790
Total depreciation and amortization ........................... $ 258,264 246,620 199,026
Adjusted segment operating income
North America Services ....................................... $ 429,064 351,512 321,619
International Services ......................................... 60,087 55,123 42,068
Merchant Services ............................................ 150,225 134,872 155,643
NetSpend ................................................... 137,837 128,285 66,353
Total adjusted segment operating income ........................ 777,213 669,792 585,683
Acquisition intangible amortization .............................. (92,522) (96,971) (65,893)
NetSpend merger and acquisition operating expenses ............. —(3,217) (14,220)
Share-based compensation .................................... (41,549) (30,790) (28,933)
Corporate Administration and Other ............................. (109,035) (107,174) (94,137)
Operating income .......................................... $ 534,107 431,640 382,500
As of December 31, 2015 2014
Total assets
North America Services ....................................... $ 3,516,328 3,327,160
International Services ......................................... 348,714 356,590
Merchant Services ............................................ 689,781 695,744
NetSpend ................................................... 1,504,740 1,556,369
Intersegment assets .......................................... (2,151,263) (2,202,282)
Total assets ............................................... $ 3,908,300 3,733,581
81