NetSpend 2015 Annual Report Download - page 60
Download and view the complete annual report
Please find page 60 of the 2015 NetSpend annual report below. You can navigate through the pages in the report by either clicking on the pages listed below, or by using the keyword search tool below to find specific information within the annual report.-
 1
1 -
2
-
3
-
4
-
5
-
6
-
7
-
8
-
9
-
10
-
11
-
12
-
13
-
14
-
15
-
16
-
17
-
18
-
19
-
20
-
21
-
22
-
23
-
24
-
25
-
26
-
27
-
28
-
29
-
30
-
31
-
32
-
33
-
34
-
35
-
36
-
37
-
38
-
39
-
40
-
41
-
42
-
43
-
44
-
45
-
46
-
47
-
48
-
49
-
 50
50 -
 51
51 -
 52
52 -
 53
53 -
 54
54 -
 55
55 -
 56
56 -
 57
57 -
 58
58 -
 59
59 -
 60
60 -
 61
61 -
 62
62 -
 63
63 -
 64
64 -
 65
65 -
 66
66 -
 67
67 -
 68
68 -
 69
69 -
 70
70 -
71
-
72
-
73
-
74
-
75
-
76
-
77
-
78
-
79
-
80
-
81
-
82
-
83
-
84
-
85
-
86
-
87
-
88
-
89
-
90
-
91
-
92
-
93
-
94
-
95
-
96
-
97
-
98
-
99
-
100
 |
 |

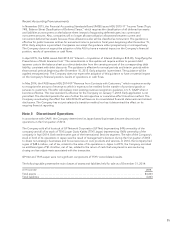
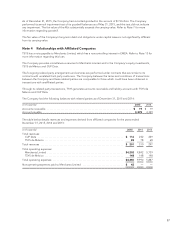
The following table presents the summarized results of discontinued operations for the years ended
December 31, 2015, 2014 and 2013:
(in thousands) 2015 2014 2013
Total revenues .......................................................... $—$16,376 68,048
Income before taxes ..................................................... $—$ 1 3,443
Income tax (benefit) expense .............................................. $—$ (39) 1,388
Income from operating activities of discontinued operations, net of tax ........... $—$ 40 2,055
Gain on dispositions, net of tax ............................................ $1,411 $48,615 —
Income from discontinued operations, net of tax .............................. $1,411 $48,655 2,055
Income from discontinued operations, net of tax, attributable to noncontrolling
interest .............................................................. $—$ 999 4,198
Income (loss) from discontinued operations, net of tax, attributable to TSYS
common shareholders .................................................. $1,411 $47,656 (2,143)
Interest allocated to discontinued operations1................................ $—$ — 281
1 Interest expense relates to borrowings directly for use by Japan-based operations.
Note 3 Fair Value Measurement
GAAP requires disclosure about how fair value is determined for assets and liabilities and establishes a hierarchy
for which these assets and liabilities must be grouped, based on significant level of inputs. The three-tier fair
value hierarchy, which prioritizes the inputs used in the valuation methodologies, is as follows:
Level 1 — Quoted prices for identical assets and liabilities in active markets.
Level 2 — Observable inputs other than quoted prices included in Level 1, such as quoted prices for similar
assets and liabilities in active markets, quoted prices for identical or similar assets and liabilities in markets that
are not active, or other inputs that are observable or can be corroborated by observable market data.
Level 3 — Unobservable inputs for the asset or liability.
The Company had no transfers between Level 1, Level 2, or Level 3 during the years ended December 31, 2015,
2014 or 2013. Goodwill is assessed annually for impairment in the second quarter of each year using fair value
measurement techniques. Specifically, goodwill impairment is determined using a two-step test. The first step of
the goodwill impairment test is used to identify potential impairment by comparing the fair value of a reporting
unit (RU) with its book value, including goodwill. If the fair value of the RU exceeds its book value, goodwill is
considered not impaired and the second step of the impairment test is unnecessary. If the book value of the RU
exceeds its fair value, the second step of the goodwill impairment test is performed to measure the amount of
impairment loss, if any. The second step of the goodwill impairment test compares the implied fair value of the
RU’s goodwill with the book value of that goodwill. If the book value of the RU’s goodwill exceeds the implied
fair value of that goodwill, an impairment loss is recognized in an amount equal to that excess. The fair value of
the RU is allocated to all of the assets and liabilities of that unit as if the RU had been acquired in a business
combination and the fair value of the RU was the purchase price paid to acquire the RU.
The estimate of fair value of the Company’s RUs is determined using various valuation techniques, including
using an equally weighted combination of the market approach and the income approach. The market approach,
which contains Level 2 inputs, utilizes readily available market valuation multiples to estimate fair value. The
income approach is a valuation technique that utilizes the discounted cash flow (DCF) method, which includes
Level 3 inputs. Under the DCF method, the fair value of the RU reflects the present value of the projected
earnings that will be generated by each RU after taking into account the revenues and expenses associated with
the asset, the relative risk that the cash flows will occur, the contribution of other assets, and an appropriate
discount rate to reflect the value of the invested capital. Cash flows are estimated for future periods based upon
historical data and projections by management.
56