NetSpend 2015 Annual Report Download - page 7
Download and view the complete annual report
Please find page 7 of the 2015 NetSpend annual report below. You can navigate through the pages in the report by either clicking on the pages listed below, or by using the keyword search tool below to find specific information within the annual report.-
 1
1 -
 2
2 -
 3
3 -
 4
4 -
 5
5 -
 6
6 -
 7
7 -
 8
8 -
 9
9 -
 10
10 -
 11
11 -
 12
12 -
 13
13 -
 14
14 -
 15
15 -
 16
16 -
 17
17 -
 18
18 -
19
-
20
-
21
-
22
-
23
-
24
-
25
-
26
-
27
-
28
-
29
-
30
-
31
-
32
-
33
-
34
-
35
-
36
-
37
-
38
-
39
-
40
-
41
-
42
-
43
-
44
-
45
-
46
-
47
-
48
-
49
-
50
-
51
-
52
-
53
-
54
-
55
-
56
-
57
-
58
-
59
-
60
-
61
-
62
-
63
-
64
-
65
-
66
-
67
-
68
-
69
-
70
-
71
-
72
-
73
-
74
-
75
-
76
-
77
-
78
-
79
-
80
-
81
-
82
-
83
-
84
-
85
-
86
-
87
-
88
-
89
-
90
-
91
-
92
-
93
-
94
-
95
-
96
-
97
-
98
-
99
-
100
 |
 |
3
Combined with higher margins, robust organic growth
made for superb consolidated results in 2015
—
and
gave us the ideal launching pad for 2016.
And what a year it’s been! Most exciting of all has
been the announcement, on January 26, 2016, of
our intent to acquire TransFirst® for $2.35 billion.
That’s the largest acquisition in our history.
TransFirst is a leading provider of payment technology
solutions to businesses across the United States. What
sets TransFirst apart is its partner-centric, vertically
focused distribution capability
—
a capability that’s
sure to accelerate our position in the high growth
area of integrated payments.
The transaction, which we aim to close in the second
quarter of 2016, will strategically position TSYS in the
highly competitive, rapidly changing merchant
acquiring landscape.
Some of the greatest innovations in payments involve
both merchants and consumers. With our TransFirst
colleagues as part of the TSYS family, we’ll be
exceptionally well-positioned to deliver on these
evolving trends.
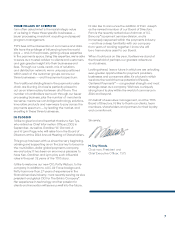
I want to share the highlights of this historic year
with you, along with how we plan to transform and
differentiate our company, and position ourselves to
lead the marketplace.
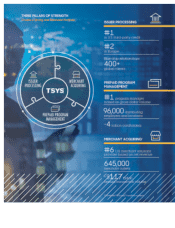
In this letter, I explain how our three businesses set
us apart in the payments space, and how we win on
scale, reach and distribution. We now service several
hundred payment providers, hundreds of thousands
of businesses and millions of consumers across the
payments landscape.
Today, that landscape is more competitive than
ever. But we’re confident that our strong, balanced
portfolio of businesses within TSYS will help us adapt
and evolve as often as this dynamic, fast-changing
industry demands. Disruptors and legacy players are
relying on TSYS to unlock the opportunities for growth
that payments can provide and keep the heart of
commerce beating strongly.
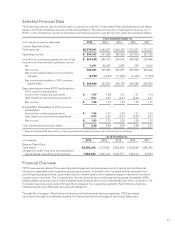
2015 FINANCIAL PERFORMANCE
It’s no accident that TSYS is operating from a position
of tremendous strength. We’ve achieved strong
financial performance because we’re able to foresee
the future of payments, and to execute and deliver
leading payment solutions at scale, with unrivaled
security and reliability.
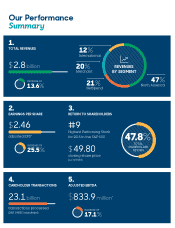
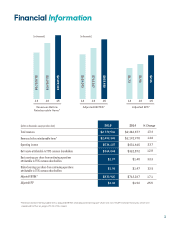
Revenue and Income: Total revenues were
$2.8 billion, resulting in double-digit growth of
13.6 percent. Revenues before reimbursable items
were $2.5 billion: up 14.0 percent.
Earnings Per Share: Adjusted earnings per share
(EPS)* was $2.46, an increase of 25.5 percent.
Adjusted EBITDA* was $833.9 million, an increase of
17.1 percent. Basic EPS from continuing operations
was $1.97, an increase of 33.3 percent. Diluted EPS
from continuing operations was $1.96, an increase
of 33.5 percent.
Return to Shareholders: TSYS stock was ranked
ninth in the S&P 500’s list of the highest performing
stocks for 2015. Our closing stock price at year end
was $49.80. We bought 5.2 million shares, totaling
$242.1 million. These purchases along with our
dividends of $73.7 million, returned $315.8 million to
our shareholders. That’s more than 92 percent of
available free cash flow for the year
—
an increase
of 31.5 percent over 2014.
Let’s take a look at our three businesses, and the
solutions we deliver.
* Revenues before reimbursable items, adjusted EBITDA and adjusted earnings per share are non-GAAP financial measures, which are
explained further on pages 29-32 of this report.