NetSpend 2015 Annual Report Download - page 29
Download and view the complete annual report
Please find page 29 of the 2015 NetSpend annual report below. You can navigate through the pages in the report by either clicking on the pages listed below, or by using the keyword search tool below to find specific information within the annual report.-
 1
1 -
2
-
3
-
4
-
5
-
6
-
7
-
8
-
9
-
10
-
11
-
12
-
13
-
14
-
15
-
16
-
17
-
18
-
 19
19 -
 20
20 -
 21
21 -
 22
22 -
 23
23 -
 24
24 -
 25
25 -
 26
26 -
 27
27 -
 28
28 -
 29
29 -
 30
30 -
 31
31 -
 32
32 -
 33
33 -
 34
34 -
 35
35 -
 36
36 -
 37
37 -
 38
38 -
 39
39 -
40
-
41
-
42
-
43
-
44
-
45
-
46
-
47
-
48
-
49
-
50
-
51
-
52
-
53
-
54
-
55
-
56
-
57
-
58
-
59
-
60
-
61
-
62
-
63
-
64
-
65
-
66
-
67
-
68
-
69
-
70
-
71
-
72
-
73
-
74
-
75
-
76
-
77
-
78
-
79
-
80
-
81
-
82
-
83
-
84
-
85
-
86
-
87
-
88
-
89
-
90
-
91
-
92
-
93
-
94
-
95
-
96
-
97
-
98
-
99
-
100
 |
 |

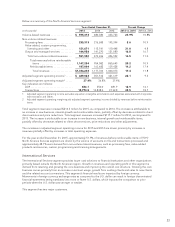
In June 2009, Bank of America announced that it formed a new joint venture to provide merchant services. In
November 2010, TSYS and Bank of America agreed to a new agreement, during the term of which TSYS expects
merchant services revenues from Bank of America to decline as Bank of America transitions its services to its new
joint venture. The loss of Bank of America as a merchant services client is not expected to have a material
adverse effect on the Merchant Services segment’s or TSYS’ financial position, results of operations or cash flows.
Effective June 2013, the Company renewed its processing agreement, which includes revenue minimums, with
Bank of America for an additional two years.
This segment has no major customers.
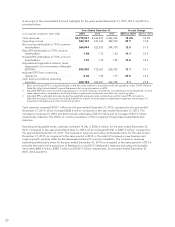
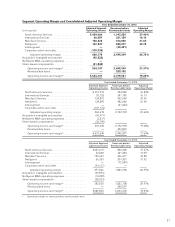
Below is a summary of the Merchant Services segment:
Years Ended December 31, Percent Change
(in thousands) 2015 2014 2013 2015 vs. 2014 2014 vs. 2013
Revenues before reimbursable items ......... $ 474,040 435,649 446,277 8.8% (2.4)%
Reimbursable items ....................... 75,329 74,471 86,773 1.2 (14.2)
Total revenues ........................... $ 549,369 510,120 533,050 7.7 (4.3)
Adjusted segment operating income1........ $ 150,225 134,872 155,643 11.4 (13.3)
Adjusted segment operating margin2........ 31.7% 31.0% 34.9%
Key indicators (in millions):
Point-of-sale transactions ................ 4,266.5 4,052.7 4,359.8 5.3 (7.0)
Dollar sales volume ..................... $48,072.7 46,846.4 44,144.0 2.6 6.1
1 Adjusted segment operating income excludes acquisition intangible amortization and expenses associated with Corporate
Administration and Other.
2 Adjusted segment operating margin equals adjusted segment operating income divided by revenues before reimbursable
items.
Total segment revenues increased $39.2 million for 2015, as compared to 2014. This increase includes increases
associated with new business, internal growth and reimbursable items offset by decreases associated with lost
business, deconversions and price reductions. Total segment revenues decreased $22.9 million for 2014, as
compared to 2013. This decrease was due primarily to lost business, deconversions and price reductions and
reimbursable items offset by new business and internal growth.
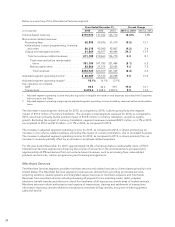
The increase in adjusted segment operating income for 2015, as compared to 2014, is driven by an increase in
revenues partially offset by increases in associated costs. The decrease in adjusted segment operating income for
2014, as compared to 2013, is driven by lower third party processing revenues and incremental costs related to
integration projects.
The Merchant Services segment results are driven by dollar sales volume and the authorization and capture
transactions processed at the point-of-sale and clearing and settlement transactions. This segment’s authorization
and capture transactions are primarily through dial-up or Internet connectivity.
For the year ended December 31, 2015 approximately 92.3% of the revenues of the Merchant Services segment,
were influenced by several factors, including volumes related to transactions and dollar sales volume. The
remaining 7.7% of this segment’s revenues were derived from value added services, chargebacks, managed
services, investigation, risk and collection services performed.
NetSpend
The NetSpend segment is a program manager for FDIC-insured depository institutions that issue GPR cards and
payroll cards and provide alternative financial services to underbanked and other consumers in the United States.
25