NetSpend 2015 Annual Report Download - page 34
Download and view the complete annual report
Please find page 34 of the 2015 NetSpend annual report below. You can navigate through the pages in the report by either clicking on the pages listed below, or by using the keyword search tool below to find specific information within the annual report.-
 1
1 -
2
-
3
-
4
-
5
-
6
-
7
-
8
-
9
-
10
-
11
-
12
-
13
-
14
-
15
-
16
-
17
-
18
-
19
-
20
-
21
-
22
-
23
-
 24
24 -
 25
25 -
 26
26 -
 27
27 -
 28
28 -
 29
29 -
 30
30 -
 31
31 -
 32
32 -
 33
33 -
 34
34 -
 35
35 -
 36
36 -
 37
37 -
 38
38 -
 39
39 -
 40
40 -
 41
41 -
 42
42 -
 43
43 -
 44
44 -
45
-
46
-
47
-
48
-
49
-
50
-
51
-
52
-
53
-
54
-
55
-
56
-
57
-
58
-
59
-
60
-
61
-
62
-
63
-
64
-
65
-
66
-
67
-
68
-
69
-
70
-
71
-
72
-
73
-
74
-
75
-
76
-
77
-
78
-
79
-
80
-
81
-
82
-
83
-
84
-
85
-
86
-
87
-
88
-
89
-
90
-
91
-
92
-
93
-
94
-
95
-
96
-
97
-
98
-
99
-
100
 |
 |

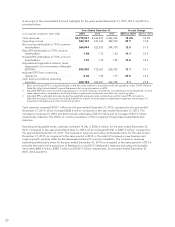
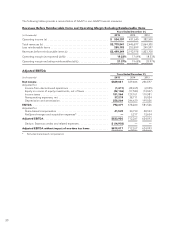
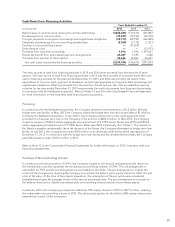
The following tables provide a reconciliation of GAAP to non-GAAP financial measures:
Revenues Before Reimbursable Items and Operating Margin Excluding Reimbursable Items
Years Ended December 31,
(in thousands) 2015 2014 2013
Operating income (a) ............................................ $ 534,107 431,640 382,500
Total revenues (b) ............................................... $2,779,541 2,446,877 2,064,305
Less reimbursable items .......................................... 280,192 253,899 240,597
Revenues before reimbursable items (c) ............................. $2,499,349 2,192,978 1,823,708
Operating margin (as reported) (a)/(b) .............................. 19.22% 17.64% 18.53%
Operating margin excluding reimbursables (a)/(c) ..................... 21.37% 19.68% 20.97%
Adjusted EBITDA
Years Ended December 31,
(in thousands) 2015 2014 2013
Net income .................................................... $369,041 329,406 256,597
Adjusted for:
Income from discontinued operations ............................. (1,411) (48,655) (2,055)
Equity in income of equity investments, net of taxes ................. (22,106) (17,583) (13,047)
Income taxes ................................................. 151,364 129,761 110,981
Nonoperating expenses, net .................................... 37,219 38,711 30,024
Depreciation and amortization ................................... 258,264 246,620 199,026
EBITDA ....................................................... 792,371 678,260 581,526
Adjusted for:
Share-based compensation ..................................... 41,549 30,790 28,933
NetSpend merger and acquisition expenses* ...................... —3,217 13,634
Adjusted EBITDA ............................................... $833,920 712,267 624,093
Deduct: State tax credits and related expenses ..................... $ (14,903) ——
Adjusted EBITDA without impact of one-time tax items ............. $819,017 712,267 624,093
* Excludes share-based compensation
30