NetSpend 2015 Annual Report Download - page 28
Download and view the complete annual report
Please find page 28 of the 2015 NetSpend annual report below. You can navigate through the pages in the report by either clicking on the pages listed below, or by using the keyword search tool below to find specific information within the annual report.-
 1
1 -
2
-
3
-
4
-
5
-
6
-
7
-
8
-
9
-
10
-
11
-
12
-
13
-
14
-
15
-
16
-
17
-
 18
18 -
 19
19 -
 20
20 -
 21
21 -
 22
22 -
 23
23 -
 24
24 -
 25
25 -
 26
26 -
 27
27 -
 28
28 -
 29
29 -
 30
30 -
 31
31 -
 32
32 -
 33
33 -
 34
34 -
 35
35 -
 36
36 -
 37
37 -
 38
38 -
39
-
40
-
41
-
42
-
43
-
44
-
45
-
46
-
47
-
48
-
49
-
50
-
51
-
52
-
53
-
54
-
55
-
56
-
57
-
58
-
59
-
60
-
61
-
62
-
63
-
64
-
65
-
66
-
67
-
68
-
69
-
70
-
71
-
72
-
73
-
74
-
75
-
76
-
77
-
78
-
79
-
80
-
81
-
82
-
83
-
84
-
85
-
86
-
87
-
88
-
89
-
90
-
91
-
92
-
93
-
94
-
95
-
96
-
97
-
98
-
99
-
100
 |
 |

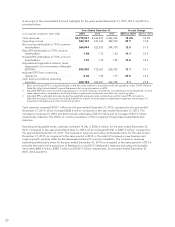
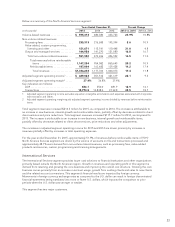
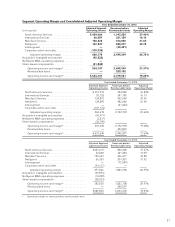
Below is a summary of the International Services segment:
Years Ended December 31, Percent Change
(in thousands) 2015 2014 2013 2015 vs. 2014 2014 vs. 2013
Volume-based revenues ..................... $119,974 131,322 126,714 (8.6)% 3.6%
Non-volume related revenues:
Processing fees .......................... 62,998 69,346 61,519 (9.2) 12.7
Value-added, custom programming, licensing
and other ............................. 86,318 95,040 92,807 (9.2) 2.4
Output and managed services .............. 61,869 46,077 40,444 34.3 13.9
Total non-volume related revenues ........ 211,185 210,463 194,770 0.3 8.1
Total revenues before reimbursable
items ............................. 331,159 341,785 321,484 (3.1) 6.3
Reimbursable items ................... 23,566 21,574 20,065 9.2 7.5
Total revenues ..................... $354,725 363,359 341,549 (2.4) 6.4
Adjusted segment operating income1......... $ 60,087 55,123 42,068 9.0 31.0
Adjusted segment operating margin2.......... 18.1% 16.1% 13.1%
Key indicators (in millions):
AOF ................................... 78.5 66.6 59.1 17.8 12.7
Transactions ............................. 2,473.6 2,268.4 2,007.4 9.0 13.0
1 Adjusted segment operating income excludes acquisition intangible amortization and expenses associated with Corporate
Administration and Other.
2 Adjusted segment operating margin equals adjusted segment operating income divided by revenues before reimbursable
items.
The decrease in total segment revenues for 2015, as compared to 2014, is driven primarily by the negative
impact of $31.0 million of currency translation. The increase in total segment revenues for 2014, as compared to
2013, was driven primarily by the positive impact of $14.8 million in currency translation, as well as organic
growth. Excluding the impact of currency translation, segment revenues increased $22.3 million, or 6.1% in 2015,
as compared to 2014 and $7.0 million, or 2.1% in 2014, as compared to 2013.
The increase in adjusted segment operating income for 2015, as compared to 2014, is driven primarily by an
increase in non-volume related revenues, excluding the impact of currency translation, due to increased business.
The increase in adjusted segment operating income for 2014, as compared to 2013, is driven primarily from an
increase in revenues partially offset by an increase in employee related expenses.
For the year ended December 31, 2015, approximately 36.2% of revenues before reimbursable items of TSYS’
International Services segment are driven by the volume of accounts on file and transactions processed and
approximately 63.8% are derived from non-volume based revenues, such as processing fees, value-added
products and services, custom programming and licensing arrangements.
Merchant Services
The Merchant Services segment provides merchant services and related services to clients based primarily in the
United States. The Merchant Services segment’s revenues are derived from providing processing services,
acquiring solutions, related systems and integrated support services to merchant acquirers and merchants.
Revenues from merchant services include processing all payment forms including credit, debit, prepaid,
electronic benefit transfer and electronic check for merchants of all sizes across a wide array of market verticals.
Merchant services include authorization and capture of transactions; clearing and settlement of transactions;
information reporting services related to transactions; merchant billing services; and point-of-sale equipment
sales and service.
24