NetSpend 2015 Annual Report Download - page 35
Download and view the complete annual report
Please find page 35 of the 2015 NetSpend annual report below. You can navigate through the pages in the report by either clicking on the pages listed below, or by using the keyword search tool below to find specific information within the annual report.-
 1
1 -
2
-
3
-
4
-
5
-
6
-
7
-
8
-
9
-
10
-
11
-
12
-
13
-
14
-
15
-
16
-
17
-
18
-
19
-
20
-
21
-
22
-
23
-
24
-
 25
25 -
 26
26 -
 27
27 -
 28
28 -
 29
29 -
 30
30 -
 31
31 -
 32
32 -
 33
33 -
 34
34 -
 35
35 -
 36
36 -
 37
37 -
 38
38 -
 39
39 -
 40
40 -
 41
41 -
 42
42 -
 43
43 -
 44
44 -
 45
45 -
46
-
47
-
48
-
49
-
50
-
51
-
52
-
53
-
54
-
55
-
56
-
57
-
58
-
59
-
60
-
61
-
62
-
63
-
64
-
65
-
66
-
67
-
68
-
69
-
70
-
71
-
72
-
73
-
74
-
75
-
76
-
77
-
78
-
79
-
80
-
81
-
82
-
83
-
84
-
85
-
86
-
87
-
88
-
89
-
90
-
91
-
92
-
93
-
94
-
95
-
96
-
97
-
98
-
99
-
100
 |
 |

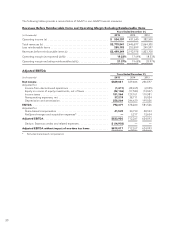
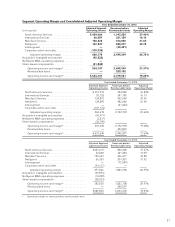
Segment Operating Margin and Consolidated Adjusted Operating Margin
Year Ended December 31, 2015
(in thousands) Adjusted Segment
Operating Income Revenues before
Reimbursable Items Adjusted
Operating Margin
North America Services ....................... $ 429,064 1,147,254 37.40%
International Services ........................ 60,087 331,159 18.14
Merchant Services ........................... 150,225 474,040 31.69
NetSpend .................................. 137,837 580,377 23.75
Intersegment ............................... — (33,481)
Corporate admin and other ................... (109,035)
Adjusted operating margin ................ 668,178 2,499,349 26.73%
Acquisition intangible amortization ............... (92,522)
NetSpend M&A operating expenses .............. —
Share-based compensation ..................... (41,549)
Operating income and margin* .............. 534,107 2,499,349 21.37%
Reimbursable items ........................ — 280,192
Operating income and margin* .............. $ 534,107 2,779,541 19.22%
Year Ended December 31, 2014
Adjusted Segment
Operating Income Revenues before
Reimbursable Items Adjusted
Operating Margin
North America Services ......................... $351,512 954,082 36.84%
International Services .......................... 55,123 341,785 16.13
Merchant Services ............................. 134,872 435,649 30.96
NetSpend .................................... 128,285 482,686 26.58
Intersegment ................................. — (21,224)
Corporate admin and other ..................... (107,174)
Adjusted operating margin .................. 562,618 2,192,978 25.66%
Acquisition intangible amortization ................. (96,971)
NetSpend M&A operating expenses ................ (3,217)
Share-based compensation ....................... (30,790)
Operating income and margin* ................ 431,640 2,192,978 19.68%
Reimbursable items .......................... — 253,899
Operating income and margin* ................ $431,640 2,446,877 17.64%
Year Ended December 31, 2013
Adjusted Segment
Operating Income Revenues before
Reimbursable Items Adjusted
Operating Margin
North America Services ......................... $321,619 860,645 37.37%
International Services .......................... 42,068 321,484 13.09
Merchant Services ............................. 155,643 446,277 34.88
NetSpend .................................... 66,353 207,851 31.92
Intersegment ................................. — (12,549)
Corporate admin and other ..................... (94,137) —
Adjusted operating margin .................. 491,546 1,823,708 26.95%
Acquisition intangible amortization ................. (65,893)
NetSpend M&A operating expenses ................ (14,220)
Share-based compensation ....................... (28,933)
Operating income and margin* ................ 382,500 1,823,708 20.97%
Reimbursable items .......................... — 240,597
Operating income and margin* ................ $382,500 2,064,305 18.53%
* Operating margin on revenue before reimbursable items
31