NetSpend 2015 Annual Report Download - page 38
Download and view the complete annual report
Please find page 38 of the 2015 NetSpend annual report below. You can navigate through the pages in the report by either clicking on the pages listed below, or by using the keyword search tool below to find specific information within the annual report.-
 1
1 -
2
-
3
-
4
-
5
-
6
-
7
-
8
-
9
-
10
-
11
-
12
-
13
-
14
-
15
-
16
-
17
-
18
-
19
-
20
-
21
-
22
-
23
-
24
-
25
-
26
-
27
-
 28
28 -
 29
29 -
 30
30 -
 31
31 -
 32
32 -
 33
33 -
 34
34 -
 35
35 -
 36
36 -
 37
37 -
 38
38 -
 39
39 -
 40
40 -
 41
41 -
 42
42 -
 43
43 -
 44
44 -
 45
45 -
 46
46 -
 47
47 -
 48
48 -
49
-
50
-
51
-
52
-
53
-
54
-
55
-
56
-
57
-
58
-
59
-
60
-
61
-
62
-
63
-
64
-
65
-
66
-
67
-
68
-
69
-
70
-
71
-
72
-
73
-
74
-
75
-
76
-
77
-
78
-
79
-
80
-
81
-
82
-
83
-
84
-
85
-
86
-
87
-
88
-
89
-
90
-
91
-
92
-
93
-
94
-
95
-
96
-
97
-
98
-
99
-
100
 |
 |
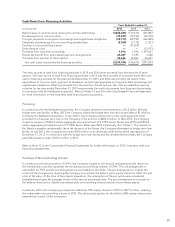
hardware. The majority of capital expenditures in 2013 related to investments in new computer processing
hardware and building improvements
Internally Developed Computer Software Costs
Additions to capitalized software development costs, including enhancements to, and development of,
processing systems, were $39.2 million in 2015, $41.5 million in 2014 and $33.6 million in 2013. The changes in
capitalized software development costs in 2015, as compared to 2014, were the result of varying levels of activity
in two corporate-wide initiatives. One initiative is a multi-year, multi-phase initiative that consists of enhancing
TSYS’ issuing processing platforms. The other is an innovation initiative focused on enhancing existing product
and service offerings through several new product concepts and ideas on how to change existing processes.
Licensed Computer Software from Vendors
Expenditures for licensed computer software from vendors for increases in processing capacity were $50.7 million
in 2015, compared to $29.6 million in 2014 and $63.6 million in 2013. The increase in expenses in 2015
compared to 2014 was due primarily to the extension of existing mainframe and distributed software
agreements. The decrease in expenditures in 2014 was due to purchases of software in 2013 in anticipation of
large conversions in future years.
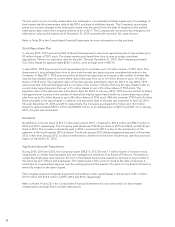
Purchases of Private Equity Investments
The Company has entered into limited partnership agreements in connection with investing in two Atlanta-based
venture capital funds focused exclusively on investing in technology-enabled financial services companies.
Pursuant to each limited partnership agreement, the Company has committed to invest up to $20.0 million in
each fund so long as its ownership interest in each fund does not exceed 50%. The Company made investments
in the fund of $3.5 million, $3.3 million and $1.4 million in 2015, 2014 and 2013, respectively. The Company
recorded gains on this investment of $4.0 million, $793,000 and $966,000 for the years ended December 31,
2015, 2014 and 2013, respectively.
Cash Used in Acquisitions
In 2014, the Company paid $38.6 million to NetSpend dissenting shareholders to settle the outstanding lawsuit
associated with the NetSpend acquisition. In 2013, the Company used cash of $1.3 billion in the acquisition of
NetSpend.
Proceeds from Insurance Recovery for Loss on Disposal
In 2014, the Company received $6.2 million of proceeds from insurance coverage related to the destruction of
property resulting from a fire. The Company recorded the loss on disposal which was more than offset by the
insurance proceeds received.
Proceeds from Dispositions
TSYS received $3.6 million in proceeds from dispositions related to the return of cash in 2015 that was placed in
escrow during closing and tax adjustments associated with the sale of the Company’s Japan-based operations in
2014. In 2014, TSYS received $45.0 million of proceeds, net of expenses paid and cash disposed in connection
with this transaction. Refer to Note 2 in the Consolidated Financial Statements for more information on
discontinued operations.
34