NetSpend 2015 Annual Report Download - page 86
Download and view the complete annual report
Please find page 86 of the 2015 NetSpend annual report below. You can navigate through the pages in the report by either clicking on the pages listed below, or by using the keyword search tool below to find specific information within the annual report.-
 1
1 -
2
-
3
-
4
-
5
-
6
-
7
-
8
-
9
-
10
-
11
-
12
-
13
-
14
-
15
-
16
-
17
-
18
-
19
-
20
-
21
-
22
-
23
-
24
-
25
-
26
-
27
-
28
-
29
-
30
-
31
-
32
-
33
-
34
-
35
-
36
-
37
-
38
-
39
-
40
-
41
-
42
-
43
-
44
-
45
-
46
-
47
-
48
-
49
-
50
-
51
-
52
-
53
-
54
-
55
-
56
-
57
-
58
-
59
-
60
-
61
-
62
-
63
-
64
-
65
-
66
-
67
-
68
-
69
-
70
-
71
-
72
-
73
-
74
-
75
-
 76
76 -
 77
77 -
 78
78 -
 79
79 -
 80
80 -
 81
81 -
 82
82 -
 83
83 -
 84
84 -
 85
85 -
 86
86 -
 87
87 -
 88
88 -
 89
89 -
 90
90 -
 91
91 -
 92
92 -
 93
93 -
 94
94 -
 95
95 -
 96
96 -
97
-
98
-
99
-
100
 |
 |

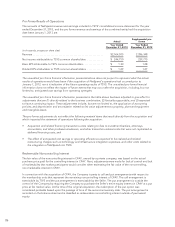
GEOGRAPHIC AREA DATA: The Company maintains property and equipment, net of accumulated
depreciation and amortization, in the following geographic areas:
As of December 31,
(in thousands) 2015 2014
United States ................................................................. $241,814 237,865
Europe ...................................................................... 41,953 45,503
Other ....................................................................... 6,131 7,217
Totals ..................................................................... $289,898 290,585
GEOGRAPHIC AREA REVENUE BY OPERATING SEGMENT: The following tables reconcile segment external
revenue to revenues by geography for the years ended December 31:
2015
(in thousands)
North
America
Services International
Services Merchant
Services NetSpend Total %
United States .................... $ 981,588 — 548,079 580,377 $2,110,044 75.9
Europe1......................... 796 303,832 22 — 304,650 11.0
Canada1......................... 288,728 — 355 — 289,083 10.4
Mexico .......................... 16,558 — — — 16,558 0.6
Other1.......................... 18,329 40,198 679 — 59,206 2.1
Total .......................... $1,305,999 344,030 549,135 580,377 $2,779,541 100.0
2014
(in thousands)
North
America
Services International
Services Merchant
Services NetSpend Total %
United States ....................... $ 778,766 — 508,747 482,686 $1,770,199 72.3
Europe1............................ 781 304,308 — — 305,089 12.5
Canada ............................ 290,248 — 248 — 290,496 11.9
Mexico ............................ 16,216 — — — 16,216 0.7
Other1............................. 16,305 47,888 684 — 64,877 2.7
Total ............................ $1,102,316 352,196 509,679 482,686 $2,446,877 100.0
2013
(in thousands)
North
America
Services International
Services Merchant
Services NetSpend Total %
United States ......................... $712,252 — 533,939 207,851 $1,454,042 70.4
Europe1............................. 774 293,803 — — 294,577 14.3
Canada .............................. 242,975 — 178 — 243,153 11.8
Mexico .............................. 16,513 — — — 16,513 0.8
Other1.............................. 14,492 40,962 566 — 56,020 2.7
Total .............................. $987,006 334,764 534,683 207,851 $2,064,305 100.0
1 Revenues are impacted by movements in foreign currency exchange rates
MAJOR CUSTOMER: For the years ended December 31, 2015, 2014 and 2013, the Company had no major
customers.
82