NetSpend 2015 Annual Report Download - page 80
Download and view the complete annual report
Please find page 80 of the 2015 NetSpend annual report below. You can navigate through the pages in the report by either clicking on the pages listed below, or by using the keyword search tool below to find specific information within the annual report.-
 1
1 -
2
-
3
-
4
-
5
-
6
-
7
-
8
-
9
-
10
-
11
-
12
-
13
-
14
-
15
-
16
-
17
-
18
-
19
-
20
-
21
-
22
-
23
-
24
-
25
-
26
-
27
-
28
-
29
-
30
-
31
-
32
-
33
-
34
-
35
-
36
-
37
-
38
-
39
-
40
-
41
-
42
-
43
-
44
-
45
-
46
-
47
-
48
-
49
-
50
-
51
-
52
-
53
-
54
-
55
-
56
-
57
-
58
-
59
-
60
-
61
-
62
-
63
-
64
-
65
-
66
-
67
-
68
-
69
-
 70
70 -
 71
71 -
 72
72 -
 73
73 -
 74
74 -
 75
75 -
 76
76 -
 77
77 -
 78
78 -
 79
79 -
 80
80 -
 81
81 -
 82
82 -
 83
83 -
 84
84 -
 85
85 -
 86
86 -
 87
87 -
 88
88 -
 89
89 -
 90
90 -
91
-
92
-
93
-
94
-
95
-
96
-
97
-
98
-
99
-
100
 |
 |

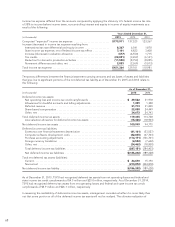
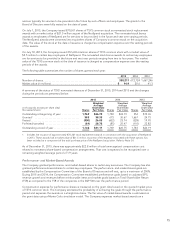
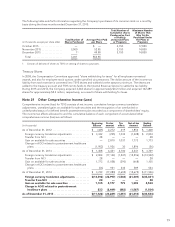
straight-line basis. Compensation costs related to performance- and market-based shares are recognized through
the longer of the performance period or the vesting period. As of December 31, 2015, there was approximately
$11.0 million of unrecognized compensation cost related to TSYS performance-based awards that is expected to
be recognized through December 2018. As of December 31, 2015, there was approximately $1.5 million of
unrecognized compensation cost related to TSYS market-based awards that is expected to be recognized
through July 2018.
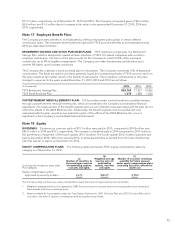
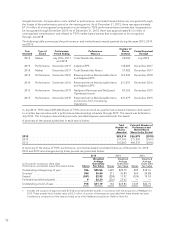
The following table summarizes the performance- and market-based awards granted during the years 2015, 2014
and 2013:
Year
Awarded Type of
Award Performance
Period Ending Performance
Measure
Number of
Shares
Granted Period Expensed
Through
2015 Market July 2016, 2017
and 2018
Total Shareholder Return 25,000 July 2018
2015 Performance December 2017 Adjusted EPS 135,289 December 2017
2015 Market December 2017 Total Shareholder Return 57,982 December 2017
2015 Performance December 2015 Revenues before Reimbursable Items
and Adjusted EPS
165,543 December 2018
2014 Performance December 2016 Revenues before Reimbursable Items
and Adjusted EPS
211,593 December 2016
2013 Performance December 2015 NetSpend Revenues and NetSpend
Operating Income
87,356 December 2015
2013 Performance December 2015 Revenues before Reimbursable Items
and Income from Continuing
Operations
237,679 December 2015
In July 2013, TSYS issued 225,000 shares of TSYS common stock as a performance-based retention stock award
to a certain key executive with a performance-based vesting schedule through 2015. This award was forfeited in
July 2014. The Company reversed all previously recorded expense associated with this award.
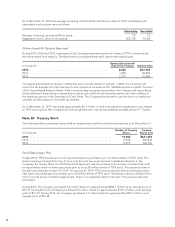
A summary of the awards authorized in each year is below:
Total
Number of
Shares
Awarded
Potential Number of
Performance-and
Market-Based
Shares to be Vested
2015 ............................................................. 383,814 526,879 (2018)
2014 .............................................................. 211,593 211,593 (2017)
2013 .............................................................. 563,803 400,539 (2016)
A summary of the status of TSYS’ performance- and market-based nonvested shares as of December 31, 2015,
2014 and 2013 and changes during those periods are presented below:
2015 2014 2013
(in thousands, except per share data)
Performance- and market-based Nonvested shares Shares
Weighted
Average
Grant Date
Fair Value Shares
Weighted
Average
Grant Date
Fair Value Shares
Weighted
Average
Grant Date
Fair Value
Outstanding at beginning of year ............. 766 $25.86 1,049 $22.75 809 $18.76
Granted1.................................. 384 36.84 211 30.89 564 24.88
Vested .................................... (241) 22.92 (258) 17.57 (324) 15.93
Forfeited/canceled/adjusted .................. 9 22.20 (236) 25.62 — —
Outstanding at end of year ................... 918 $31.19 766 $25.86 1,049 $22.75
1 Includes the issuance of approximately 87,356 stock replacement awards in connection with the acquisition of NetSpend in
2013. These awards had a market value of $2.2 million. A portion of the expense associated with these awards has been
included as a component of the total purchase price of the NetSpend acquisition. Refer to Note 24.
76