NetSpend 2015 Annual Report Download - page 46
Download and view the complete annual report
Please find page 46 of the 2015 NetSpend annual report below. You can navigate through the pages in the report by either clicking on the pages listed below, or by using the keyword search tool below to find specific information within the annual report.-
 1
1 -
2
-
3
-
4
-
5
-
6
-
7
-
8
-
9
-
10
-
11
-
12
-
13
-
14
-
15
-
16
-
17
-
18
-
19
-
20
-
21
-
22
-
23
-
24
-
25
-
26
-
27
-
28
-
29
-
30
-
31
-
32
-
33
-
34
-
35
-
 36
36 -
 37
37 -
 38
38 -
 39
39 -
 40
40 -
 41
41 -
 42
42 -
 43
43 -
 44
44 -
 45
45 -
 46
46 -
 47
47 -
 48
48 -
 49
49 -
 50
50 -
 51
51 -
 52
52 -
 53
53 -
 54
54 -
 55
55 -
 56
56 -
57
-
58
-
59
-
60
-
61
-
62
-
63
-
64
-
65
-
66
-
67
-
68
-
69
-
70
-
71
-
72
-
73
-
74
-
75
-
76
-
77
-
78
-
79
-
80
-
81
-
82
-
83
-
84
-
85
-
86
-
87
-
88
-
89
-
90
-
91
-
92
-
93
-
94
-
95
-
96
-
97
-
98
-
99
-
100
 |
 |

Consolidated Statements of Income
Years Ended December 31,
(in thousands, except per share data) 2015 2014 2013
Total revenues (Notes 4 and 22) ................................... $2,779,541 2,446,877 2,064,305
Cost of services ................................................. 1,855,181 1,668,892 1,369,438
Selling, general and administrative expenses ......................... 390,253 346,345 312,367
Total operating expenses ....................................... 2,245,434 2,015,237 1,681,805
Operating income ............................................. 534,107 431,640 382,500
Nonoperating expenses, net ...................................... (37,219) (38,711) (30,024)
Income before income taxes and equity in income of equity
investments ................................................ 496,888 392,929 352,476
Income taxes (Note 15) ........................................... 151,364 129,761 110,981
Income before equity in income of equity investments ................. 345,524 263,168 241,495
Equity in income of equity investments, net of tax (Note 12) ............ 22,106 17,583 13,047
Income from continuing operations, net of tax ....................... 367,630 280,751 254,542
Income from discontinued operations, net of tax ..................... 1,411 48,655 2,055
Net income .................................................. 369,041 329,406 256,597
Net income attributable to noncontrolling interests ................. (4,997) (6,534) (11,847)
Net income attributable to Total System Services, Inc. (TSYS) common
shareholders ................................................ $ 364,044 322,872 244,750
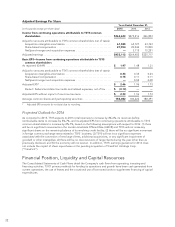
Basic earnings per share (EPS) attributable to TSYS common shareholders
(Note 26)
Income from continuing operations to TSYS common shareholders . . $ 1.97 1.48 1.31
Gain (loss) from discontinued operations to TSYS common
shareholders .............................................. 0.01 0.26 (0.01)
Net income attributable to TSYS common shareholders* ........... $ 1.98 1.73 1.30
Diluted EPS attributable to TSYS common shareholders (Note 26)
Income from continuing operations to TSYS common shareholders . . $ 1.96 1.47 1.30
Gain (loss) from discontinued operations to TSYS common
shareholders .............................................. 0.01 0.25 (0.01)
Net income attributable to TSYS common shareholders* ........... $ 1.97 1.72 1.29
Amounts attributable to TSYS common shareholders:
Income from continuing operations ............................. $ 362,633 275,216 246,893
Gain (loss) from discontinued operations ........................ 1,411 47,656 (2,143)
Net income ................................................. $ 364,044 322,872 244,750
* EPS amounts may not total due to rounding
See accompanying Notes to Consolidated Financial Statements
42