Metro PCS 2011 Annual Report Download - page 94
Download and view the complete annual report
Please find page 94 of the 2011 Metro PCS annual report below. You can navigate through the pages in the report by either clicking on the pages listed below, or by using the keyword search tool below to find specific information within the annual report.-
 1
1 -
2
-
3
-
4
-
5
-
6
-
7
-
8
-
9
-
10
-
11
-
12
-
13
-
14
-
15
-
16
-
17
-
18
-
19
-
20
-
21
-
22
-
23
-
24
-
25
-
26
-
27
-
28
-
29
-
30
-
31
-
32
-
33
-
34
-
35
-
36
-
37
-
38
-
39
-
40
-
41
-
42
-
43
-
44
-
45
-
46
-
47
-
48
-
49
-
50
-
51
-
52
-
53
-
54
-
55
-
56
-
57
-
58
-
59
-
60
-
61
-
62
-
63
-
64
-
65
-
66
-
67
-
68
-
69
-
70
-
71
-
72
-
73
-
74
-
75
-
76
-
77
-
78
-
79
-
80
-
81
-
82
-
83
-
 84
84 -
 85
85 -
 86
86 -
 87
87 -
 88
88 -
 89
89 -
 90
90 -
 91
91 -
 92
92 -
 93
93 -
 94
94 -
 95
95 -
 96
96 -
 97
97 -
 98
98 -
 99
99 -
 100
100 -
 101
101 -
 102
102 -
 103
103 -
 104
104 -
105
-
106
-
107
-
108
-
109
-
110
-
111
-
112
-
113
-
114
-
115
-
116
-
117
-
118
-
119
-
120
-
121
-
122
-
123
-
124
-
125
-
126
-
127
-
128
-
129
-
130
-
131
-
132
-
133
-
134
-
135
-
136
-
137
-
138
-
139
-
140
-
141
-
142
-
143
-
144
-
145
-
146
-
147
-
148
 |
 |
83
our efforts to increase the service area and capacity of our existing network. We believe the increased service area and capacity
in existing markets will improve our service offerings, helping us to attract additional customers and retain existing customers
resulting in increased revenues.
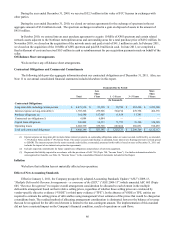
As of December 31, 2011, we owed an aggregate of approximately $4.5 billion under our senior secured credit facility, as
amended, 7 7/8% Senior Notes and 6 5/8% Senior Notes, as well as $281.2 million under our capital lease obligations.
Operating Activities
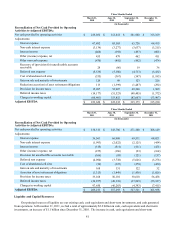
Cash provided by operating activities increased $67.3 million to approximately $1.1 billion during the year ended
December 31, 2011 from $994.5 million for the year ended December 31, 2010. The increase is primarily attributable to a 56%
increase in net income for the year ended December 31, 2011 compared to the same period in 2010, partially offset by an
decrease in cash flows provided by changes in working capital during the year ended December 31, 2011 compared to the same
period in 2010.
Cash provided by operating activities increased $95.2 million to $994.5 million during the year ended December 31, 2010
from $899.3 million for the year ended December 31, 2009. The increase is primarily attributable to an increase in operating
income during the year ended December 31, 2010, partially offset by a decrease in cash flows provided by changes in working
capital during the year ended December 31, 2010 compared to the same period in 2009.
Cash provided by operating activities increased $451.9 million to $899.3 million during the year ended December 31,
2009 from $447.5 million for the year ended December 31, 2008. The increase was primarily attributable to an increase in cash
flows from working capital changes and an increase in operating income during the year ended December 31, 2009 compared
to the same period in 2008.
Investing Activities
Cash used in investing activities was $886.9 million during the year ended December 31, 2011 compared to $950.4
million during the year ended December 31, 2010. Cash flows provided by net purchases of short-term investments increased
$224.6 million for the year ended December 31, 2011 compared to the same period in 2010, partially offset by a $99.4 million
increase in purchases of property and equipment and a $90.0 million increase in cash outflows from changes in prepaid
purchases of property and equipment.
Cash used in investing activities was $950.4 million during the year ended December 31, 2010 compared to
approximately $1.1 billion during the year ended December 31, 2009. The decrease was due primarily to a $74.8 million
decrease in net purchases and maturities of short-term investments during the year ended December 31, 2010, coupled with a
$61.3 million increase in cash flows from changes in prepaid purchases of property and equipment and a $41.3 million decrease
in purchases of property and equipment.
Cash used in investing activities was approximately $1.1 billion during the year ended December 31, 2009 compared to
approximately $1.3 billion during the year ended December 31, 2008. The decrease was due primarily to a $313.0 million
decrease in purchases of FCC licenses as well as a $122.9 million decrease in purchases of property and equipment, partially
offset by an approximate $224.2 million increase in net purchases of short-term investments.
Financing Activities
Cash provided by financing activities was $971.8 million during the year ended December 31, 2011 compared to cash
used in financing activities of $176.9 million during the year ended December 31, 2010. The increase was due primarily to
$961.7 million in net proceeds from debt issuance during the year ended December 31, 2011 compared to $47.4 million in net
retirement of long-term debt during the same period in 2010 as well as a $86.2 million increase in cash provided by changes in
book overdraft and a $49.0 million increase in proceeds from exercise of stock options.
Cash used in financing activities was $176.9 million during the year ended December 31, 2010 compared to cash
provided by financing activities of $449.0 million during the year ended December 31, 2009. The decrease during 2010 was
mainly attributable to $2.0 billion in cash used for the redemption of the 9¼% Senior Notes as well as a $62.4 million decrease
in book overdraft, partially offset by a net $1.5 billion increase in proceeds from the issuance of senior notes.
Cash provided by financing activities was $449.0 million during the year ended December 31, 2009 compared to $74.5
million during the year ended December 31, 2008. The increase was due primarily to $480.3 million in net proceeds from the
issuance of additional 9¼% Senior Notes in January 2009, partially offset by a $99.7 million decrease in book overdraft.