Metro PCS 2011 Annual Report Download - page 141
Download and view the complete annual report
Please find page 141 of the 2011 Metro PCS annual report below. You can navigate through the pages in the report by either clicking on the pages listed below, or by using the keyword search tool below to find specific information within the annual report.-
 1
1 -
2
-
3
-
4
-
5
-
6
-
7
-
8
-
9
-
10
-
11
-
12
-
13
-
14
-
15
-
16
-
17
-
18
-
19
-
20
-
21
-
22
-
23
-
24
-
25
-
26
-
27
-
28
-
29
-
30
-
31
-
32
-
33
-
34
-
35
-
36
-
37
-
38
-
39
-
40
-
41
-
42
-
43
-
44
-
45
-
46
-
47
-
48
-
49
-
50
-
51
-
52
-
53
-
54
-
55
-
56
-
57
-
58
-
59
-
60
-
61
-
62
-
63
-
64
-
65
-
66
-
67
-
68
-
69
-
70
-
71
-
72
-
73
-
74
-
75
-
76
-
77
-
78
-
79
-
80
-
81
-
82
-
83
-
84
-
85
-
86
-
87
-
88
-
89
-
90
-
91
-
92
-
93
-
94
-
95
-
96
-
97
-
98
-
99
-
100
-
101
-
102
-
103
-
104
-
105
-
106
-
107
-
108
-
109
-
110
-
111
-
112
-
113
-
114
-
115
-
116
-
117
-
118
-
119
-
120
-
121
-
122
-
123
-
124
-
125
-
126
-
127
-
128
-
129
-
130
-
 131
131 -
 132
132 -
 133
133 -
 134
134 -
 135
135 -
 136
136 -
 137
137 -
 138
138 -
 139
139 -
 140
140 -
 141
141 -
 142
142 -
 143
143 -
 144
144 -
 145
145 -
 146
146 -
 147
147 -
 148
148
 |
 |
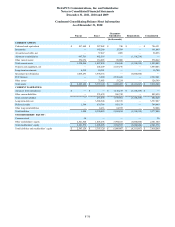
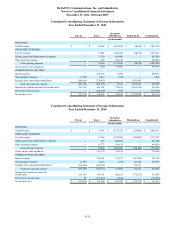
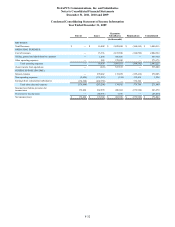
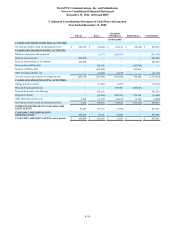
MetroPCS Communications, Inc. and Subsidiaries
Notes to Consolidated Financial Statements
December 31, 2011, 2010 and 2009
F-35
Condensed Consolidating Statement of Cash Flows Information
Year Ended December 31, 2009
Parent Issuer Guarantor
Subsidiaries Eliminations Consolidated
(in thousands)
CASH FLOWS FROM OPERATING ACTIVITIES:
Net cash provided by (used in) operating activities $ 258,785 $ (26,058) $ 683,212 $ (16,590) $ 899,349
CASH FLOWS FROM INVESTING ACTIVITIES:
Purchases of property and equipment — (9,177) (822,497) — (831,674)
Purchase of investments (486,645) — — — (486,645)
Proceeds from maturity of investments 262,500 — — — 262,500
Proceeds from affiliate debt — 296,700 — (296,700) —
Issuance of affiliate debt — (465,000) — 465,000 —
Other investing activities, net — (52,028) (9,107) — (61,135)
Net cash (used in) provided by investing activities (224,145) (229,505) (831,604) 168,300 (1,116,954)
CASH FLOWS FROM FINANCING ACTIVITIES:
Change in book overdraft — (17,047) (3,267) — (20,314)
Proceeds from long-term loan — — 465,000 (465,000) —
Proceeds from senior note offerings — 492,250 — — 492,250
Repayment of debt — (16,000) (296,700) 296,700 (16,000)
Other financing activities, net 8,626 (11,925) (20,189) 16,590 (6,898)
Net cash provided by (used in) financing activities 8,626 447,278 144,844 (151,710) 449,038
INCREASE (DECREASE) IN CASH AND CASH
EQUIVALENTS 43,266 191,715 (3,548) — 231,433
CASH AND CASH EQUIVALENTS,
beginning of period 598,823 78,121 21,004 — 697,948
CASH AND CASH EQUIVALENTS, end of period $ 642,089 $ 269,836 $ 17,456 $ — $ 929,381