Metro PCS 2011 Annual Report Download - page 85
Download and view the complete annual report
Please find page 85 of the 2011 Metro PCS annual report below. You can navigate through the pages in the report by either clicking on the pages listed below, or by using the keyword search tool below to find specific information within the annual report.-
 1
1 -
2
-
3
-
4
-
5
-
6
-
7
-
8
-
9
-
10
-
11
-
12
-
13
-
14
-
15
-
16
-
17
-
18
-
19
-
20
-
21
-
22
-
23
-
24
-
25
-
26
-
27
-
28
-
29
-
30
-
31
-
32
-
33
-
34
-
35
-
36
-
37
-
38
-
39
-
40
-
41
-
42
-
43
-
44
-
45
-
46
-
47
-
48
-
49
-
50
-
51
-
52
-
53
-
54
-
55
-
56
-
57
-
58
-
59
-
60
-
61
-
62
-
63
-
64
-
65
-
66
-
67
-
68
-
69
-
70
-
71
-
72
-
73
-
74
-
 75
75 -
 76
76 -
 77
77 -
 78
78 -
 79
79 -
 80
80 -
 81
81 -
 82
82 -
 83
83 -
 84
84 -
 85
85 -
 86
86 -
 87
87 -
 88
88 -
 89
89 -
 90
90 -
 91
91 -
 92
92 -
 93
93 -
 94
94 -
 95
95 -
96
-
97
-
98
-
99
-
100
-
101
-
102
-
103
-
104
-
105
-
106
-
107
-
108
-
109
-
110
-
111
-
112
-
113
-
114
-
115
-
116
-
117
-
118
-
119
-
120
-
121
-
122
-
123
-
124
-
125
-
126
-
127
-
128
-
129
-
130
-
131
-
132
-
133
-
134
-
135
-
136
-
137
-
138
-
139
-
140
-
141
-
142
-
143
-
144
-
145
-
146
-
147
-
148
 |
 |

74
non-GAAP performance measures and a further discussion of the measures, please read “— Reconciliation of non-GAAP
Financial Measures” below.
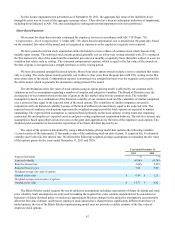
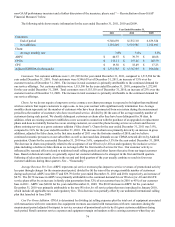
The following table shows metric information for the year ended December 31, 2011, 2010 and 2009.
Year Ended December 31,
2011 2010 2009
Customers:
End of period 9,346,659 8,155,110 6,639,524
Net additions 1,191,549 1,515,586 1,272,691
Churn:
Average monthly rate 3.8% 3.6% 5.5%
ARPU $ 40.57 $ 39.79 $ 40.68
CPGA $ 173.11 $ 157.26 $ 145.79
CPU $ 19.56 $ 18.49 $ 17.23
Adjusted EBITDA (in thousands) $ 1,331,783 $ 1,176,355 $ 956,244
Customers. Net customer additions were 1,191,549 for the year ended December 31, 2011, compared to 1,515,586 for the
year ended December 31, 2010. Total customers were 9,346,659 as of December 31, 2011, an increase of 15% over the
customer total as of December 31, 2010. The increase in total customers is primarily attributable to the continued demand for
our service offerings. Net customer additions were 1,515,586 for the year ended December 31, 2010, compared to 1,272,691
for the year ended December 31, 2009. Total customers were 8,155,110 as of December 31, 2010, an increase of 23% over the
customer total as of December 31, 2009. The increase in total customers is primarily attributable to the continued demand for
our service offerings.
Churn. As we do not require a long-term service contract, our churn percentage is expected to be higher than traditional
wireless carriers that require customers to sign a one- to two-year contract with significant early termination fees. Average
monthly churn represents (a) the number of customers who have been disconnected from our system during the measurement
period less the number of customers who have reactivated service, divided by (b) the sum of the average monthly number of
customers during such period. We classify delinquent customers as churn after they have been delinquent for 30 days. In
addition, when an existing customer establishes a new account in connection with the purchase of an upgraded or replacement
phone and does not identify themselves as an existing customer, we count the phone leaving service as a churn and the new
phone entering service as a gross customer addition (“false churn”). Churn for the year ended December 31, 2011 was 3.8%,
compared to 3.6% for the year ended December 31, 2010. The increase in churn was primarily driven by an increase in gross
additions, adjusted for false churn, in the first nine months of 2011 over the first nine months of 2010, and we believe
continued economic pressures on our subscribers as well as increased data demands on our CDMA network driven by Android
penetration. Churn for the year ended December 31, 2010 was 3.6%, compared to 5.5% for the year ended December 31, 2009.
The decrease in churn was primarily related to the acceptance of our Wireless for All tax and regulatory fee inclusive service
plans including a decline in false churn as we no longer offer the first month of service for free. Our customer activity is
influenced by seasonal effects related to traditional retail selling periods and other factors that arise from our target customer
base. Based on historical results, we generally expect net customer additions to be strongest in the first and fourth quarters.
Softening of sales and increased churn in the second and third quarters of the year usually combine to result in fewer net
customer additions during these quarters. See – “Seasonality.”
Average Revenue Per User. ARPU represents (a) service revenues plus impact to service revenues of promotional activity
less pass through charges for the measurement period, divided by (b) the sum of the average monthly number of customers
during such period. ARPU was $40.57 and $39.79 for the year ended December 31, 2011 and 2010, respectively, an increase of
$0.78. The $0.78 increase in ARPU was primarily attributable to the continued demand for our Wireless for All and 4G LTE
service plans offset by an increase in family plan penetration from 32% of our customer base in 2010 to 45% of our customer
base in 2011. ARPU was $40.68 for the year ended December 31, 2009. The $0.89 decrease in ARPU for the year ended
December 31, 2010 was primarily attributable to the new Wireless for All service plans that were introduced in January 2010,
which include all applicable taxes and regulatory fees. This decrease was partially offset by our unlimited international calling
plan that launched in June 2009.
Cost Per Gross Addition. CPGA is determined by dividing (a) selling expenses plus the total cost of equipment associated
with transactions with new customers less equipment revenues associated with transactions with new customers during the
measurement period adjusted for impact to service revenues of promotional activity by (b) gross customer additions during
such period. Retail customer service expenses and equipment margin on handsets sold to existing customers when they are