Metro PCS 2011 Annual Report Download - page 108
Download and view the complete annual report
Please find page 108 of the 2011 Metro PCS annual report below. You can navigate through the pages in the report by either clicking on the pages listed below, or by using the keyword search tool below to find specific information within the annual report.-
 1
1 -
2
-
3
-
4
-
5
-
6
-
7
-
8
-
9
-
10
-
11
-
12
-
13
-
14
-
15
-
16
-
17
-
18
-
19
-
20
-
21
-
22
-
23
-
24
-
25
-
26
-
27
-
28
-
29
-
30
-
31
-
32
-
33
-
34
-
35
-
36
-
37
-
38
-
39
-
40
-
41
-
42
-
43
-
44
-
45
-
46
-
47
-
48
-
49
-
50
-
51
-
52
-
53
-
54
-
55
-
56
-
57
-
58
-
59
-
60
-
61
-
62
-
63
-
64
-
65
-
66
-
67
-
68
-
69
-
70
-
71
-
72
-
73
-
74
-
75
-
76
-
77
-
78
-
79
-
80
-
81
-
82
-
83
-
84
-
85
-
86
-
87
-
88
-
89
-
90
-
91
-
92
-
93
-
94
-
95
-
96
-
97
-
 98
98 -
 99
99 -
 100
100 -
 101
101 -
 102
102 -
 103
103 -
 104
104 -
 105
105 -
 106
106 -
 107
107 -
 108
108 -
 109
109 -
 110
110 -
 111
111 -
 112
112 -
 113
113 -
 114
114 -
 115
115 -
 116
116 -
 117
117 -
 118
118 -
119
-
120
-
121
-
122
-
123
-
124
-
125
-
126
-
127
-
128
-
129
-
130
-
131
-
132
-
133
-
134
-
135
-
136
-
137
-
138
-
139
-
140
-
141
-
142
-
143
-
144
-
145
-
146
-
147
-
148
 |
 |

F-2
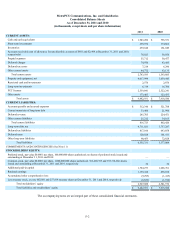
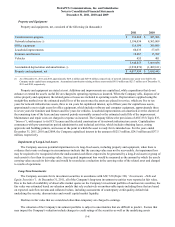
MetroPCS Communications, Inc. and Subsidiaries
Consolidated Balance Sheets
As of December 31, 2011 and 2010
(in thousands, except share and per share information)
2011 2010
CURRENT ASSETS:
Cash and cash equivalents $ 1,943,282 $ 796,531
Short-term investments 299,972 374,862
Inventories 239,648 161,049
Accounts receivable (net of allowance for uncollectible accounts of $601 and $2,494 at December 31, 2011 and 2010,
respectively) 78,023 58,056
Prepaid expenses 55,712 50,477
Deferred charges 74,970 83,485
Deferred tax assets 7,214 6,290
Other current assets 44,772 63,135
Total current assets 2,743,593 1,593,885
Property and equipment, net 4,017,999 3,659,445
Restricted cash and investments 2,576 2,876
Long-term investments 6,319 16,700
FCC licenses 2,539,041 2,522,241
Other assets 173,403 123,433
Total assets $ 9,482,931 $ 7,918,580
CURRENT LIABILITIES:
Accounts payable and accrued expenses $ 512,346 $ 521,788
Current maturities of long-term debt 33,460 21,996
Deferred revenue 245,705 224,471
Other current liabilities 25,212 34,165
Total current liabilities 816,723 802,420
Long-term debt, net 4,711,021 3,757,287
Deferred tax liabilities 817,106 643,058
Deferred rents 120,028 101,411
Other long-term liabilities 90,453 72,828
Total liabilities 6,555,331 5,377,004
COMMITMENTS AND CONTINGENCIES (See Note 11)
STOCKHOLDERS’ EQUITY:
Preferred stock, par value $0.0001 per share, 100,000,000 shares authorized; no shares of preferred stock issued and
outstanding at December 31, 2011 and 2010 — —
Common stock, par value $0.0001 per share, 1,000,000,000 shares authorized, 362,460,395 and 355,318,666 shares
issued and outstanding at December 31, 2011 and 2010, respectively 36 36
Additional paid-in capital 1,784,273 1,686,761
Retained earnings 1,159,418 858,108
Accumulated other comprehensive loss (9,295) (1,415)
Less treasury stock, at cost, 602,881 and 237,818 treasury shares at December 31, 2011 and 2010, respectively (6,832) (1,914)
Total stockholders’ equity 2,927,600 2,541,576
Total liabilities and stockholders’ equity $ 9,482,931 $ 7,918,580
The accompanying notes are an integral part of these consolidated financial statements.