Metro PCS 2011 Annual Report Download - page 90
Download and view the complete annual report
Please find page 90 of the 2011 Metro PCS annual report below. You can navigate through the pages in the report by either clicking on the pages listed below, or by using the keyword search tool below to find specific information within the annual report.-
 1
1 -
2
-
3
-
4
-
5
-
6
-
7
-
8
-
9
-
10
-
11
-
12
-
13
-
14
-
15
-
16
-
17
-
18
-
19
-
20
-
21
-
22
-
23
-
24
-
25
-
26
-
27
-
28
-
29
-
30
-
31
-
32
-
33
-
34
-
35
-
36
-
37
-
38
-
39
-
40
-
41
-
42
-
43
-
44
-
45
-
46
-
47
-
48
-
49
-
50
-
51
-
52
-
53
-
54
-
55
-
56
-
57
-
58
-
59
-
60
-
61
-
62
-
63
-
64
-
65
-
66
-
67
-
68
-
69
-
70
-
71
-
72
-
73
-
74
-
75
-
76
-
77
-
78
-
79
-
 80
80 -
 81
81 -
 82
82 -
 83
83 -
 84
84 -
 85
85 -
 86
86 -
 87
87 -
 88
88 -
 89
89 -
 90
90 -
 91
91 -
 92
92 -
 93
93 -
 94
94 -
 95
95 -
 96
96 -
 97
97 -
 98
98 -
 99
99 -
 100
100 -
101
-
102
-
103
-
104
-
105
-
106
-
107
-
108
-
109
-
110
-
111
-
112
-
113
-
114
-
115
-
116
-
117
-
118
-
119
-
120
-
121
-
122
-
123
-
124
-
125
-
126
-
127
-
128
-
129
-
130
-
131
-
132
-
133
-
134
-
135
-
136
-
137
-
138
-
139
-
140
-
141
-
142
-
143
-
144
-
145
-
146
-
147
-
148
 |
 |

79
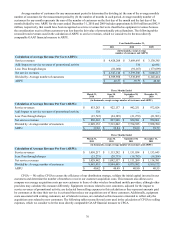
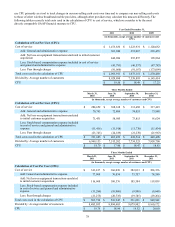
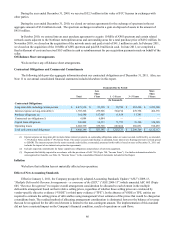
Adjusted EBITDA — We utilize Adjusted EBITDA to monitor the financial performance of our operations. This
measurement, together with GAAP measures such as revenue and income from operations, assists management in its decision-
making process related to the operation of our business. Adjusted EBITDA has limitations as an analytical tool and should not
be considered in isolation or as a substitute for income from operations, net income, or any other measure of financial
performance reported in accordance with GAAP. In addition, other wireless carriers may calculate this measure differently.
We believe that analysts and investors use Adjusted EBITDA as a supplemental measure to evaluate our overall operating
performance and that this metric facilitates comparisons with other wireless communications companies. We use Adjusted
EBITDA internally as a metric to evaluate and compensate our personnel and management for their performance, and as a
benchmark to evaluate our operating performance in comparison to our competitors. Management also uses Adjusted EBITDA
to measure, from period-to-period, our ability to provide cash flows to meet future debt services, capital expenditures and
working capital requirements and fund future growth. The following tables illustrate the calculation of Adjusted EBITDA and
reconcile Adjusted EBITDA to net income and cash flows from operating activities, which we consider to be the most directly
comparable GAAP financial measures to Adjusted EBITDA.
Year Ended December 31,
2011 2010 2009
(in thousands)
Calculation of Adjusted EBITDA:
Net income $ 301,310 $ 193,415 $ 176,844
Adjustments:
Depreciation and amortization 538,835 449,732 377,856
Loss (gain) on disposal of assets 3,619 (38,812)(4,683)
Stock-based compensation expense 41,791 46,537 47,783
Interest expense 261,073 263,125 270,285
Interest income (2,028)(1,954)(2,870)
Other (income) expense, net (699) 1,807 1,808
Impairment loss on investment securities — — 2,386
Loss on extinguishment of debt 9,536 143,626 —
Provision for income taxes 178,346 118,879 86,835
Adjusted EBITDA $ 1,331,783 $ 1,176,355 $ 956,244
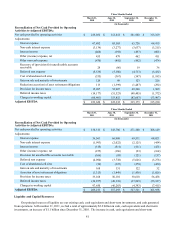
Three Months Ended
March 31,
2010 June 30,
2010 September 30,
2010 December 31,
2010
(in thousands)
Calculation of Adjusted EBITDA:
Net income $ 22,661 $ 79,915 $ 77,287 $ 13,552
Adjustments:
Depreciation and amortization 107,801 109,302 113,804 118,826
(Gain) loss on disposal of assets (828) 2,700 (18,333)(22,351)
Stock-based compensation expense 11,416 11,918 11,770 11,434
Interest expense 67,482 65,503 65,726 64,415
Interest income (464)(392)(497)(601)
Other (income) expense, net 455 479 462 411
Loss on extinguishment of debt — — 15,590 128,035
Provision for income taxes 15,097 52,907 49,366 1,509
Adjusted EBITDA $ 223,620 $ 322,332 $ 315,175 $ 315,230