Metro PCS 2011 Annual Report Download - page 83
Download and view the complete annual report
Please find page 83 of the 2011 Metro PCS annual report below. You can navigate through the pages in the report by either clicking on the pages listed below, or by using the keyword search tool below to find specific information within the annual report.-
 1
1 -
2
-
3
-
4
-
5
-
6
-
7
-
8
-
9
-
10
-
11
-
12
-
13
-
14
-
15
-
16
-
17
-
18
-
19
-
20
-
21
-
22
-
23
-
24
-
25
-
26
-
27
-
28
-
29
-
30
-
31
-
32
-
33
-
34
-
35
-
36
-
37
-
38
-
39
-
40
-
41
-
42
-
43
-
44
-
45
-
46
-
47
-
48
-
49
-
50
-
51
-
52
-
53
-
54
-
55
-
56
-
57
-
58
-
59
-
60
-
61
-
62
-
63
-
64
-
65
-
66
-
67
-
68
-
69
-
70
-
71
-
72
-
 73
73 -
 74
74 -
 75
75 -
 76
76 -
 77
77 -
 78
78 -
 79
79 -
 80
80 -
 81
81 -
 82
82 -
 83
83 -
 84
84 -
 85
85 -
 86
86 -
 87
87 -
 88
88 -
 89
89 -
 90
90 -
 91
91 -
 92
92 -
 93
93 -
94
-
95
-
96
-
97
-
98
-
99
-
100
-
101
-
102
-
103
-
104
-
105
-
106
-
107
-
108
-
109
-
110
-
111
-
112
-
113
-
114
-
115
-
116
-
117
-
118
-
119
-
120
-
121
-
122
-
123
-
124
-
125
-
126
-
127
-
128
-
129
-
130
-
131
-
132
-
133
-
134
-
135
-
136
-
137
-
138
-
139
-
140
-
141
-
142
-
143
-
144
-
145
-
146
-
147
-
148
 |
 |

72
Year Ended December 31, 2010 Compared to Year Ended December 31, 2009
Operating Items
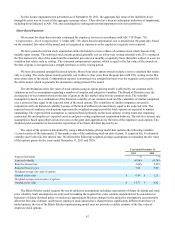
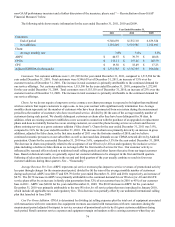
Set forth below is a summary of certain financial information for the periods indicated:
Year Ended December 31,
2010 2009 Change
(in thousands)
REVENUES:
Service revenues $ 3,689,695 $ 3,130,385 18%
Equipment revenues 379,658 350,130 8%
Total revenues 4,069,353 3,480,515 17%
OPERATING EXPENSES:
Cost of service (excluding depreciation and amortization disclosed
separately below)(1) 1,223,931 1,120,052 9%
Cost of equipment 1,093,944 884,272 24%
Selling, general and administrative expenses (excluding depreciation and
amortization disclosed separately below)(1) 621,660 567,730 9%
Depreciation and amortization 449,732 377,856 19%
Gain on disposal of assets (38,812)(4,683) **
Total operating expenses 3,350,455 2,945,227 14%
Income from operations $ 718,898 $ 535,288 34%
_____________________________
** Not meaningful.
(1) Cost of service and selling, general and administrative expenses include stock-based compensation expense. For the year ended December 31, 2010, cost
of service includes $3.5 million and selling, general and administrative expenses includes $43.0 million of stock-based compensation expense. For the
year ended December 31, 2009, cost of service includes $4.2 million and selling, general and administrative expenses includes $43.6 million of stock-
based compensation expense.
Service Revenues. Service revenues increased $559.3 million, or 18%, to approximately $3.7 billion for the year ended
December 31, 2010 from approximately $3.1 billion for the year ended December 31, 2009. The increase in service revenues is
primarily attributable to net customer additions of 1.5 million customers for the twelve months ended December 31, 2010.
Equipment Revenues. Equipment revenues increased $29.5 million, or 8%, to $379.6 million for the year ended December
31, 2010 from $350.1 million for the year ended December 31, 2009. The increase is primarily attributable to an increase in
upgrade handset sales to existing customers accounting for $85.9 million. This increase was partially offset by lower average
price of handsets activated reducing equipment revenues by $17.7 million coupled with $42.2 million that would have been
recognized as service revenues but was classified as equipment revenues during the year ended December 31, 2009, in
accordance with ASC 605, because the consideration received from customers was less than the fair value of promotionally
priced handsets.
Cost of Service. Cost of service increased $103.9 million, or 9%, to $1.2 billion for the year ended December 31, 2010
from $1.1 billion for the year ended December 31, 2009. The increase in cost of service is primarily attributable to the 23%
growth in our customer base and the deployment of additional network infrastructure, including network infrastructure for 4G
LTE, during the twelve months ended December 31, 2010 and costs associated with our unlimited international calling product.
Cost of Equipment. Cost of equipment increased $209.7 million, or 24%, to approximately $1.1 billion for the year ended
December 31, 2010 from $884.3 million for the year ended December 31, 2009. The increase is primarily attributable to higher
upgrade handset costs to existing customers which led to a $248.2 million increase, partially offset by a decrease in gross
customer additions accounting for a $37.3 million decrease.
Selling, General and Administrative Expenses. Selling, general and administrative expenses increased $54.0 million, or
9%, to $621.7 million for the year ended December 31, 2010 from $567.7 million for the year ended December 31, 2009.
Selling expenses increased by $28.3 million, or 9%, for the year ended December 31, 2010 compared to the year ended
December 31, 2009. The increase in selling expenses is primarily attributable to a $37.0 million increase in marketing and
advertising expenses as well as a $4.4 million increase in employee related costs to support our growth. These increases were