Metro PCS 2011 Annual Report Download - page 72
Download and view the complete annual report
Please find page 72 of the 2011 Metro PCS annual report below. You can navigate through the pages in the report by either clicking on the pages listed below, or by using the keyword search tool below to find specific information within the annual report.-
 1
1 -
2
-
3
-
4
-
5
-
6
-
7
-
8
-
9
-
10
-
11
-
12
-
13
-
14
-
15
-
16
-
17
-
18
-
19
-
20
-
21
-
22
-
23
-
24
-
25
-
26
-
27
-
28
-
29
-
30
-
31
-
32
-
33
-
34
-
35
-
36
-
37
-
38
-
39
-
40
-
41
-
42
-
43
-
44
-
45
-
46
-
47
-
48
-
49
-
50
-
51
-
52
-
53
-
54
-
55
-
56
-
57
-
58
-
59
-
60
-
61
-
 62
62 -
 63
63 -
 64
64 -
 65
65 -
 66
66 -
 67
67 -
 68
68 -
 69
69 -
 70
70 -
 71
71 -
 72
72 -
 73
73 -
 74
74 -
 75
75 -
 76
76 -
 77
77 -
 78
78 -
 79
79 -
 80
80 -
 81
81 -
 82
82 -
83
-
84
-
85
-
86
-
87
-
88
-
89
-
90
-
91
-
92
-
93
-
94
-
95
-
96
-
97
-
98
-
99
-
100
-
101
-
102
-
103
-
104
-
105
-
106
-
107
-
108
-
109
-
110
-
111
-
112
-
113
-
114
-
115
-
116
-
117
-
118
-
119
-
120
-
121
-
122
-
123
-
124
-
125
-
126
-
127
-
128
-
129
-
130
-
131
-
132
-
133
-
134
-
135
-
136
-
137
-
138
-
139
-
140
-
141
-
142
-
143
-
144
-
145
-
146
-
147
-
148
 |
 |

61
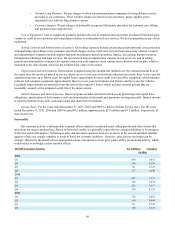
Item 6. Selected Financial Data
The following tables set forth selected consolidated financial data. We derived our selected consolidated financial data as
of and for the years ended December 31, 2011, 2010, 2009, 2008 and 2007 from our consolidated financial statements. The
historical selected financial data may not be indicative of future performance and should be read in conjunction with
“Management's Discussion and Analysis of Financial Condition and Results of Operations” and “Risk Factors” in this report.
Year Ended December 31,
2011 2010 2009 2008 2007
(In Thousands, Except Share and Per Share Data)
Statement of Operations Data:
Revenues:
Service revenues $ 4,428,208 $ 3,689,695 $ 3,130,385 $ 2,437,250 $ 1,919,197
Equipment revenues 419,174 379,658 350,130 314,266 316,537
Total revenues 4,847,382 4,069,353 3,480,515 2,751,516 2,235,734
Operating expenses:
Cost of service (excluding depreciation and amortization
disclosed separately below) 1,473,836 1,223,931 1,120,052 857,295 647,510
Cost of equipment 1,439,595 1,093,944 884,272 704,648 597,233
Selling, general and administrative expenses (excluding
depreciation and amortization disclosed separately below) 643,959 621,660 567,730 447,582 352,020
Depreciation and amortization 538,835 449,732 377,856 255,319 178,202
Loss (gain) on disposal of assets 3,619 (38,812) (4,683) 18,905 655
Total operating expenses 4,099,844 3,350,455 2,945,227 2,283,749 1,775,620
Income from operations 747,538 718,898 535,288 467,767 460,114
Other expense (income):
Interest expense 261,073 263,125 270,285 179,398 201,746
Interest income (2,028) (1,954) (2,870) (22,947) (63,933)
Other (income) expense, net (699) 1,807 1,808 1,035 1,000
Loss on extinguishment of debt 9,536 143,626 — — —
Impairment loss on investment securities — — 2,386 30,857 97,800
Total other expense 267,882 406,604 271,609 188,343 236,613
Income before provision for income taxes 479,656 312,294 263,679 279,424 223,501
Provision for income taxes (178,346) (118,879) (86,835) (129,986) (123,098)
Net income 301,310 193,415 176,844 149,438 100,403
Accrued dividends on Series D Preferred Stock — — — — (6,499)
Accrued dividends on Series E Preferred Stock — — — — (929)
Accretion on Series D Preferred Stock — — — — (148)
Accretion on Series E Preferred Stock — — — — (106)
Net income applicable to Common Stock $ 301,310 $ 193,415 $ 176,844 $ 149,438 $ 92,721
Net income per common share(1):
Basic $ 0.83 $ 0.54 $ 0.50 $ 0.43 $ 0.29
Diluted $ 0.82 $ 0.54 $ 0.49 $ 0.42 $ 0.28
Weighted average shares(1):
Basic 360,410,168 353,711,045 351,898,898 349,395,285 287,692,280
Diluted 363,837,940 356,135,089 355,942,921 355,380,111 296,337,724
Year Ended December 31,
2011 2010 2009 2008 2007
(In Thousands)
Other Financial Data:
Net cash provided by operating activities $ 1,061,808 $ 994,500 $ 899,349 $ 447,490 $ 589,306
Net cash used in investing activities (886,871) (950,418) (1,116,954) (1,294,275) (517,088)
Net cash provided by (used in) financing activities 971,814 (176,932) 449,038 74,525 1,236,492