Metro PCS 2011 Annual Report Download - page 138
Download and view the complete annual report
Please find page 138 of the 2011 Metro PCS annual report below. You can navigate through the pages in the report by either clicking on the pages listed below, or by using the keyword search tool below to find specific information within the annual report.-
 1
1 -
2
-
3
-
4
-
5
-
6
-
7
-
8
-
9
-
10
-
11
-
12
-
13
-
14
-
15
-
16
-
17
-
18
-
19
-
20
-
21
-
22
-
23
-
24
-
25
-
26
-
27
-
28
-
29
-
30
-
31
-
32
-
33
-
34
-
35
-
36
-
37
-
38
-
39
-
40
-
41
-
42
-
43
-
44
-
45
-
46
-
47
-
48
-
49
-
50
-
51
-
52
-
53
-
54
-
55
-
56
-
57
-
58
-
59
-
60
-
61
-
62
-
63
-
64
-
65
-
66
-
67
-
68
-
69
-
70
-
71
-
72
-
73
-
74
-
75
-
76
-
77
-
78
-
79
-
80
-
81
-
82
-
83
-
84
-
85
-
86
-
87
-
88
-
89
-
90
-
91
-
92
-
93
-
94
-
95
-
96
-
97
-
98
-
99
-
100
-
101
-
102
-
103
-
104
-
105
-
106
-
107
-
108
-
109
-
110
-
111
-
112
-
113
-
114
-
115
-
116
-
117
-
118
-
119
-
120
-
121
-
122
-
123
-
124
-
125
-
126
-
127
-
 128
128 -
 129
129 -
 130
130 -
 131
131 -
 132
132 -
 133
133 -
 134
134 -
 135
135 -
 136
136 -
 137
137 -
 138
138 -
 139
139 -
 140
140 -
 141
141 -
 142
142 -
 143
143 -
 144
144 -
 145
145 -
 146
146 -
 147
147 -
 148
148
 |
 |

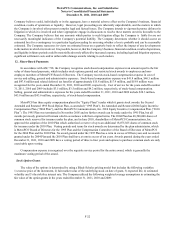
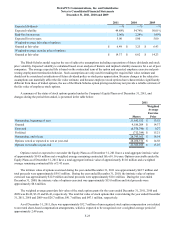
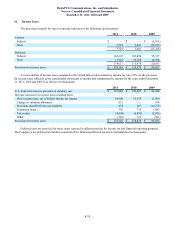
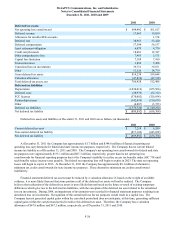
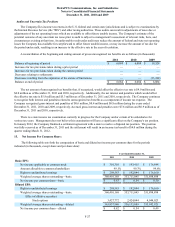
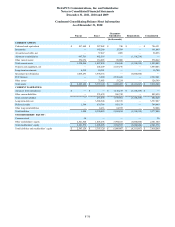
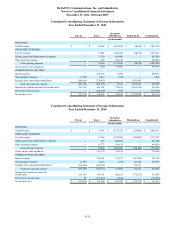
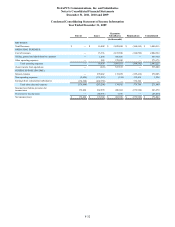
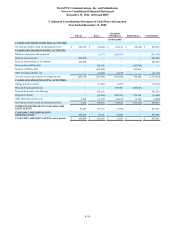
MetroPCS Communications, Inc. and Subsidiaries
Notes to Consolidated Financial Statements
December 31, 2011, 2010 and 2009
F-32
Condensed Consolidating Statement of Income Information
Year Ended December 31, 2009
Parent Issuer Guarantor
Subsidiaries Eliminations Consolidated
(in thousands)
REVENUES:
Total Revenues $ — $ 16,409 $ 3,628,698 $ (164,592) $ 3,480,515
OPERATING EXPENSES:
Cost of revenues — 15,336 2,153,580 (164,592) 2,004,324
Selling, general and administrative expenses — 1,074 566,656 — 567,730
Other operating expenses — 228 372,945 — 373,173
Total operating expenses — 16,638 3,093,181 (164,592) 2,945,227
(Loss) income from operations — (229) 535,517 — 535,288
OTHER EXPENSE (INCOME):
Interest expense — 270,662 135,039 (135,416) 270,285
Non-operating expenses (2,456) (131,512) (124) 135,416 1,324
Earnings from consolidated subsidiaries (174,388) (402,358) — 576,746 —
Total other (income) expense (176,844) (263,208) 134,915 576,746 271,609
Income (loss) before provision for
income taxes 176,844 262,979 400,602 (576,746) 263,679
Provision for income taxes — (88,591) 1,756 — (86,835)
Net income (loss) $ 176,844 $ 174,388 $ 402,358 $ (576,746) $ 176,844