Metro PCS 2011 Annual Report Download - page 89
Download and view the complete annual report
Please find page 89 of the 2011 Metro PCS annual report below. You can navigate through the pages in the report by either clicking on the pages listed below, or by using the keyword search tool below to find specific information within the annual report.-
 1
1 -
2
-
3
-
4
-
5
-
6
-
7
-
8
-
9
-
10
-
11
-
12
-
13
-
14
-
15
-
16
-
17
-
18
-
19
-
20
-
21
-
22
-
23
-
24
-
25
-
26
-
27
-
28
-
29
-
30
-
31
-
32
-
33
-
34
-
35
-
36
-
37
-
38
-
39
-
40
-
41
-
42
-
43
-
44
-
45
-
46
-
47
-
48
-
49
-
50
-
51
-
52
-
53
-
54
-
55
-
56
-
57
-
58
-
59
-
60
-
61
-
62
-
63
-
64
-
65
-
66
-
67
-
68
-
69
-
70
-
71
-
72
-
73
-
74
-
75
-
76
-
77
-
78
-
 79
79 -
 80
80 -
 81
81 -
 82
82 -
 83
83 -
 84
84 -
 85
85 -
 86
86 -
 87
87 -
 88
88 -
 89
89 -
 90
90 -
 91
91 -
 92
92 -
 93
93 -
 94
94 -
 95
95 -
 96
96 -
 97
97 -
 98
98 -
 99
99 -
100
-
101
-
102
-
103
-
104
-
105
-
106
-
107
-
108
-
109
-
110
-
111
-
112
-
113
-
114
-
115
-
116
-
117
-
118
-
119
-
120
-
121
-
122
-
123
-
124
-
125
-
126
-
127
-
128
-
129
-
130
-
131
-
132
-
133
-
134
-
135
-
136
-
137
-
138
-
139
-
140
-
141
-
142
-
143
-
144
-
145
-
146
-
147
-
148
 |
 |
78
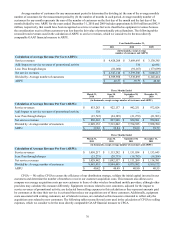
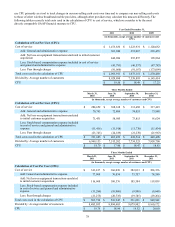
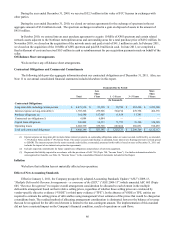
use CPU primarily as a tool to track changes in our non-selling cash costs over time and to compare our non-selling cash costs
to those of other wireless broadband mobile providers, although other providers may calculate this measure differently. The
following tables reconcile total costs used in the calculation of CPU to cost of service, which we consider to be the most
directly comparable GAAP financial measure to CPU.
Year Ended December 31,
2011 2010 2009
(in thousands, except average number of customers and
CPU)
Calculation of Cost Per User (CPU):
Cost of service $ 1,473,836 $ 1,223,931 $ 1,120,052
Add: General and administrative expense 301,940 291,067 265,455
Add: Net loss on equipment transactions unrelated to initial customer
acquisition 442,986 295,857 105,864
Less: Stock-based compensation expense included in cost of service
and general and administrative expense (41,791)(46,537)(47,783)
Less: Pass through charges (81,060)(91,167)(173,099)
Total costs used in the calculation of CPU $ 2,095,911 $ 1,673,151 $ 1,270,489
Divided by: Average number of customers 8,929,898 7,538,895 6,145,414
CPU $ 19.56 $ 18.49 $ 17.23
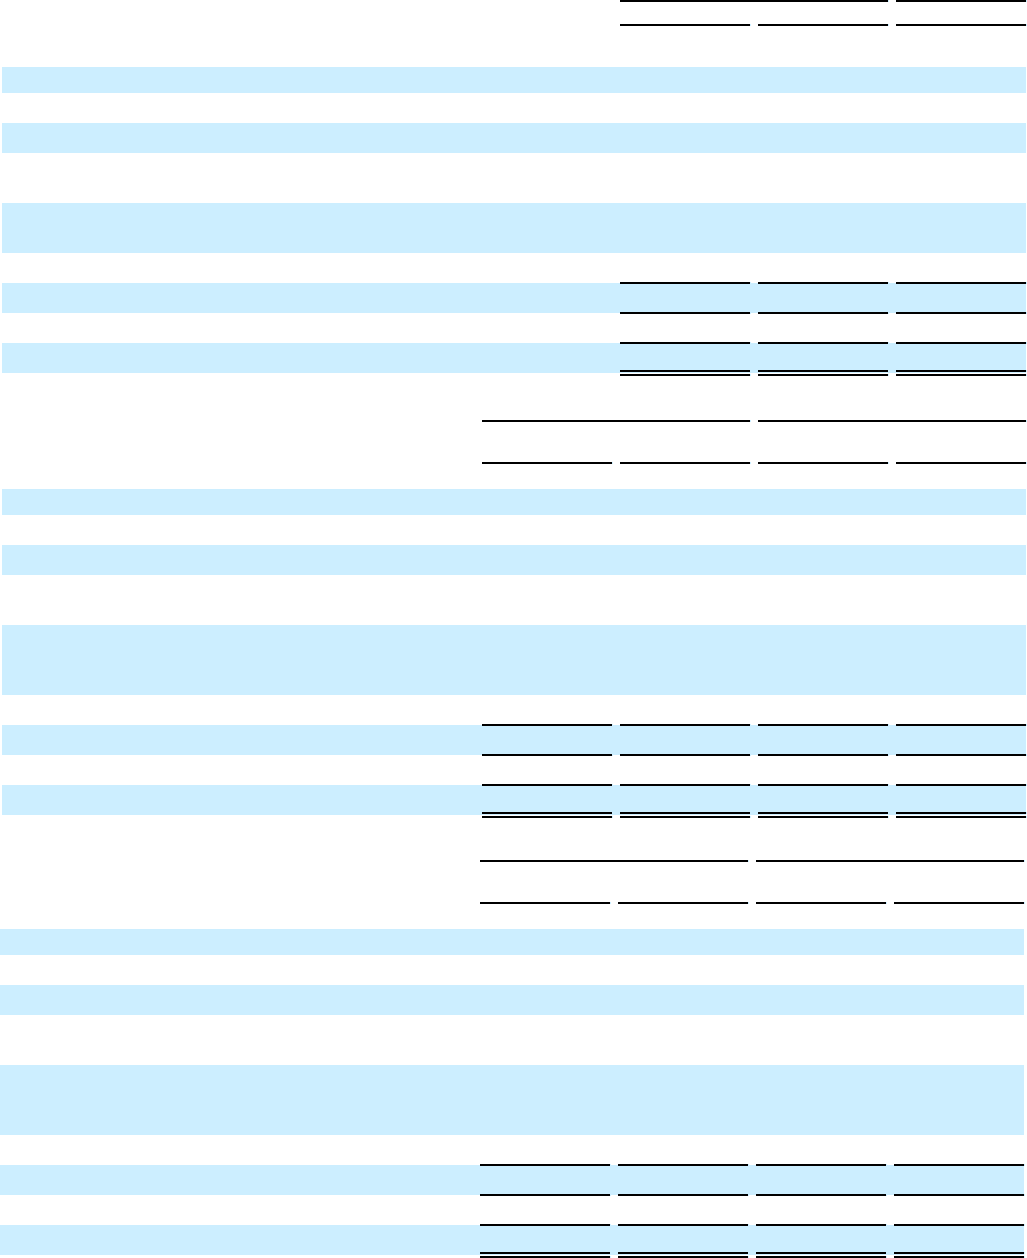
Three Months Ended
March 31,
2010 June 30,
2010 September 30,
2010 December 31,
2010
(in thousands, except average number of customers and CPU)
Calculation of Cost Per User (CPU):
Cost of service $ 284,652 $ 308,168 $ 313,688 $ 317,423
Add: General and administrative expense 70,763 72,406 74,051 73,848
Add: Net loss on equipment transactions unrelated
to initial customer acquisition 71,431 58,985 73,815 91,624
Less: Stock-based compensation expense included
in cost of service and general and administrative
expense (11,416)(11,918)(11,770)(11,434)
Less: Pass through charges (23,745)(24,189)(21,270)(21,963)
Total costs used in the calculation of CPU $ 391,685 $ 403,452 $ 428,514 $ 449,498
Divided by: Average number of customers 6,949,153 7,513,202 7,734,525 7,958,700
CPU $ 18.79 $ 17.90 $ 18.47 $ 18.83
Three Months Ended
March 31,
2011 June 30,
2011 September 30,
2011 December 31,
2011
(in thousands, except average number of customers and CPU)
Calculation of Cost Per User (CPU):
Cost of service $ 341,417 $ 366,030 $ 382,033 $ 384,356
Add: General and administrative expense 77,908 76,034 73,757 74,240
Add: Net loss on equipment transactions unrelated
to initial customer acquisition 116,968 100,576 105,584 119,859
Less: Stock-based compensation expense included
in cost of service and general and administrative
expense (11,284)(10,960)(9,898)(9,649)
Less: Pass through charges (21,275)(20,735)(19,785)(19,264)
Total costs used in the calculation of CPU $ 503,734 $ 510,945 $ 531,691 $ 549,542
Divided by: Average number of customers 8,485,035 8,994,405 9,079,982 9,160,172
CPU $ 19.79 $ 18.94 $ 19.52 $ 20.00