Metro PCS 2011 Annual Report Download - page 84
Download and view the complete annual report
Please find page 84 of the 2011 Metro PCS annual report below. You can navigate through the pages in the report by either clicking on the pages listed below, or by using the keyword search tool below to find specific information within the annual report.-
 1
1 -
2
-
3
-
4
-
5
-
6
-
7
-
8
-
9
-
10
-
11
-
12
-
13
-
14
-
15
-
16
-
17
-
18
-
19
-
20
-
21
-
22
-
23
-
24
-
25
-
26
-
27
-
28
-
29
-
30
-
31
-
32
-
33
-
34
-
35
-
36
-
37
-
38
-
39
-
40
-
41
-
42
-
43
-
44
-
45
-
46
-
47
-
48
-
49
-
50
-
51
-
52
-
53
-
54
-
55
-
56
-
57
-
58
-
59
-
60
-
61
-
62
-
63
-
64
-
65
-
66
-
67
-
68
-
69
-
70
-
71
-
72
-
73
-
 74
74 -
 75
75 -
 76
76 -
 77
77 -
 78
78 -
 79
79 -
 80
80 -
 81
81 -
 82
82 -
 83
83 -
 84
84 -
 85
85 -
 86
86 -
 87
87 -
 88
88 -
 89
89 -
 90
90 -
 91
91 -
 92
92 -
 93
93 -
 94
94 -
95
-
96
-
97
-
98
-
99
-
100
-
101
-
102
-
103
-
104
-
105
-
106
-
107
-
108
-
109
-
110
-
111
-
112
-
113
-
114
-
115
-
116
-
117
-
118
-
119
-
120
-
121
-
122
-
123
-
124
-
125
-
126
-
127
-
128
-
129
-
130
-
131
-
132
-
133
-
134
-
135
-
136
-
137
-
138
-
139
-
140
-
141
-
142
-
143
-
144
-
145
-
146
-
147
-
148
 |
 |

73
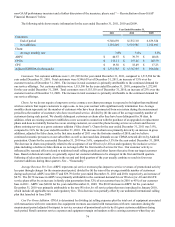
partially offset by a $13.1 million decrease in MetroFLASH® expense. General and administrative expenses increased $26.2
million, or 12%, for the year ended December 31, 2010 as compared to the year ended December 31, 2009 primarily due to the
growth in our business.
Depreciation and Amortization. Depreciation and amortization expense increased $71.9 million, or 19%, to $449.7
million for the year ended December 31, 2010 from $377.8 million for the year ended December 31, 2009. The increase
related primarily to an increase in network infrastructure assets placed into service during the twelve months ended December
31, 2010 to support the continued growth and expansion of our network.
Gain on Disposal of Assets. Gain on disposal of assets increased $34.1 million to $38.8 million for the year ended
December 31, 2010 from $4.7 million for the year ended December 31, 2009. The increase in the gain on disposal of assets
was primarily due to spectrum exchange agreements consummated during the year ended December 31, 2010, partially offset
by a loss on disposal of assets related to certain network technology that was retired and replaced with newer technology during
the year ended December 31, 2010.
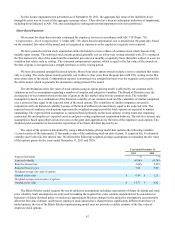
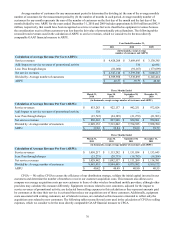
Non-Operating Items
Year Ended December 31,
2010 2009 Change
(in thousands)
Interest expense $ 263,125 $ 270,285 (3%)
Loss on extinguishment of debt 143,626 — 100%
Provision for income taxes 118,879 86,835 37%
Net income 193,415 176,844 9%
Interest Expense. Interest expense decreased $7.2 million, or 3%, to $263.1 million for the year ended December 31, 2010
from $270.3 million for the year ended December 31, 2009. The decrease in interest expense was primarily attributable to a
$28.1 million reduction in interest expense on the senior secured credit facility as a result of a lower weighted average annual
interest rate due to the interest rate protection agreements that were effective on February 1, 2010, partially offset by a decrease
in capitalized interest of $13.0 million. Our weighted average interest rate decreased to 7.29% for the twelve months ended
December 31, 2010 compared to 8.23% for the twelve months ended December 31, 2009. Average debt outstanding for the
twelve months ended December 31, 2010 and 2009 was approximately $3.6 billion and $3.5 billion, respectively.
Loss on Extinguishment of Debt. The loss on extinguishment of debt of $143.6 million for the year ended December 31,
2010 was due to the redemption of $1.95 billion of outstanding aggregate principal amount of the 9¼% Senior Notes due 2014
during the year ended December 31, 2010.
Provision for Income Taxes. Income tax expense was $118.9 million and $86.8 million for the years ended December 31,
2010 and 2009, respectively. The effective tax rate was 38.1% and 32.9% for the year ended December 31, 2010 and 2009,
respectively. For the years ended December 31, 2010 and 2009, our effective rate differs from the statutory federal rate of
35.0% due to net state and local taxes, tax credits, non-deductible expenses, valuation allowance on impairment on investment
securities and a net change in uncertain tax positions. Provision for income taxes for the year ended December 31, 2010
includes a benefit of $6.9 million related to income tax credits. Provision for income taxes for the year ended December 31,
2009 includes a net decrease in a state unrecognized tax benefit of $18.1 million due to the expiration of a statute of limitations.
Net Income. Net income increased $16.6 million, or 9%, to $193.4 million for the year ended December 31, 2010
compared to $176.8 million for the year ended December 31, 2009. The increase was primarily attributable to a 34% increase
in income from operations combined with a 3% decrease in interest expense, partially offset by a 37% increase in provision for
income taxes and a loss on extinguishment of debt.
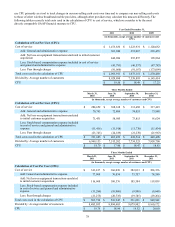
Performance Measures
In managing our business and assessing our financial performance, we supplement the information provided by financial
statement measures with several customer-focused performance metrics that are widely used in the wireless industry. These
metrics include average revenue per user per month, or ARPU, which measures service revenue per customer; cost per gross
customer addition, or CPGA, which measures the average cost of acquiring a new customer; cost per user per month, or CPU,
which measures the non-selling cash cost of operating our business on a per customer basis; churn, which measures turnover in
our customer base; and Adjusted EBITDA, which measures the financial performance of our operations. For a reconciliation of