Metro PCS 2011 Annual Report Download - page 91
Download and view the complete annual report
Please find page 91 of the 2011 Metro PCS annual report below. You can navigate through the pages in the report by either clicking on the pages listed below, or by using the keyword search tool below to find specific information within the annual report.-
 1
1 -
2
-
3
-
4
-
5
-
6
-
7
-
8
-
9
-
10
-
11
-
12
-
13
-
14
-
15
-
16
-
17
-
18
-
19
-
20
-
21
-
22
-
23
-
24
-
25
-
26
-
27
-
28
-
29
-
30
-
31
-
32
-
33
-
34
-
35
-
36
-
37
-
38
-
39
-
40
-
41
-
42
-
43
-
44
-
45
-
46
-
47
-
48
-
49
-
50
-
51
-
52
-
53
-
54
-
55
-
56
-
57
-
58
-
59
-
60
-
61
-
62
-
63
-
64
-
65
-
66
-
67
-
68
-
69
-
70
-
71
-
72
-
73
-
74
-
75
-
76
-
77
-
78
-
79
-
80
-
 81
81 -
 82
82 -
 83
83 -
 84
84 -
 85
85 -
 86
86 -
 87
87 -
 88
88 -
 89
89 -
 90
90 -
 91
91 -
 92
92 -
 93
93 -
 94
94 -
 95
95 -
 96
96 -
 97
97 -
 98
98 -
 99
99 -
 100
100 -
 101
101 -
102
-
103
-
104
-
105
-
106
-
107
-
108
-
109
-
110
-
111
-
112
-
113
-
114
-
115
-
116
-
117
-
118
-
119
-
120
-
121
-
122
-
123
-
124
-
125
-
126
-
127
-
128
-
129
-
130
-
131
-
132
-
133
-
134
-
135
-
136
-
137
-
138
-
139
-
140
-
141
-
142
-
143
-
144
-
145
-
146
-
147
-
148
 |
 |

80
Three Months Ended
March 31,
2011 June 30,
2011 September 30,
2011 December 31,
2011
(in thousands)
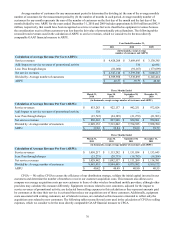
Calculation of Adjusted EBITDA:
Net income $ 56,378 $ 84,335 $ 69,326 $ 91,271
Adjustments:
Depreciation and amortization 128,695 134,525 139,309 136,306
(Gain) loss on disposal of assets (105) 1,553 1,283 888
Stock-based compensation expense 11,284 10,960 9,898 9,649
Interest expense 56,561 66,980 69,511 68,021
Interest income (515)(511)(531)(471)
Other (income) expense, net (255)(186)(93)(164)
Loss on extinguishment of debt — 9,536 — —
Provision for income taxes 33,168 50,101 38,618 56,458
Adjusted EBITDA $ 285,211 $ 357,293 $ 327,321 $ 361,958
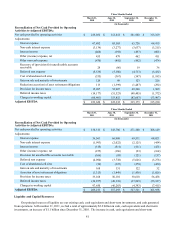
Year Ended December 31,
2011 2010 2009
(in thousands)
Reconciliation of Net Cash Provided by Operating Activities to
Adjusted EBITDA:
Net cash provided by operating activities $ 1,061,808 $ 994,500 $ 899,349
Adjustments:
Interest expense 261,073 263,125 270,285
Non-cash interest expense (6,595)(13,264)(11,309)
Interest income (2,028)(1,954)(2,870)
Other (income) expense, net (699) 1,807 1,808
Other non-cash expense —(1,929)(1,567)
Provision for uncollectible accounts receivable (518)(2)(199)
Deferred rent expense (18,828)(21,080)(24,222)
Cost of abandoned cell sites (1,099)(2,633)(8,286)
Gain on sale and maturity of investments 493 566 644
Accretion of asset retirement obligations (5,224)(3,063)(5,111)
Provision for income taxes 178,346 118,879 86,835
Deferred income taxes (174,617)(115,478)(110,161)
Changes in working capital 39,671 (43,119)(138,952)
Adjusted EBITDA $ 1,331,783 $ 1,176,355 $ 956,244